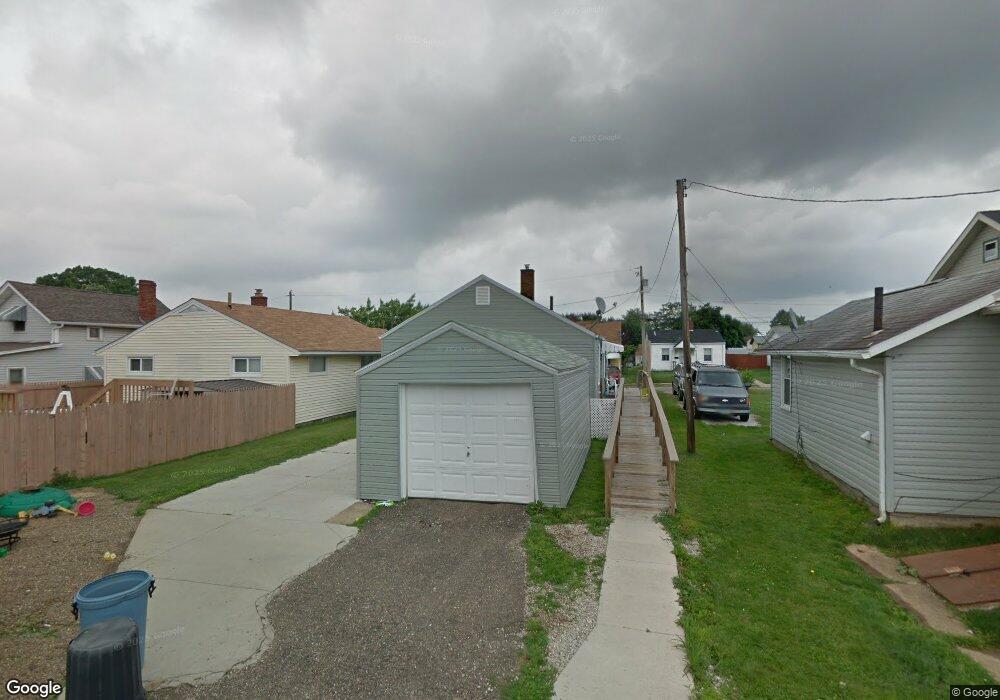
1235 Ardmore Ave SW Canton, OH 44710
Souers NeighborhoodEstimated Value: $73,968 - $90,000
2
Beds
1
Bath
692
Sq Ft
$119/Sq Ft
Est. Value
About This Home
This home is located at 1235 Ardmore Ave SW, Canton, OH 44710 and is currently estimated at $82,242, approximately $118 per square foot. 1235 Ardmore Ave SW is a home located in Stark County with nearby schools including Early Learning Center @ Schreiber, Cedar Elementary School, and McGregor Elementary School.
Ownership History
Date
Name
Owned For
Owner Type
Purchase Details
Closed on
Jun 21, 2016
Sold by
Elliott Kenny J and Elliott Melody L
Bought by
Global Rental Property Llc
Current Estimated Value
Home Financials for this Owner
Home Financials are based on the most recent Mortgage that was taken out on this home.
Original Mortgage
$18,000
Outstanding Balance
$1,586
Interest Rate
3.61%
Mortgage Type
Future Advance Clause Open End Mortgage
Estimated Equity
$80,656
Purchase Details
Closed on
Jul 27, 2007
Sold by
Locker Properties Llc
Bought by
Elliott Kenny J and Elliott Melody L
Purchase Details
Closed on
Jul 9, 2004
Sold by
Locker Glen L
Bought by
Locker Properties Llc
Home Financials for this Owner
Home Financials are based on the most recent Mortgage that was taken out on this home.
Original Mortgage
$152,000
Interest Rate
6.39%
Mortgage Type
Seller Take Back
Purchase Details
Closed on
Aug 18, 1993
Create a Home Valuation Report for This Property
The Home Valuation Report is an in-depth analysis detailing your home's value as well as a comparison with similar homes in the area
Home Values in the Area
Average Home Value in this Area
Purchase History
| Date | Buyer | Sale Price | Title Company |
|---|---|---|---|
| Global Rental Property Llc | $20,000 | None Available | |
| Elliott Kenny J | $20,000 | Attorney | |
| Locker Properties Llc | $152,000 | -- | |
| -- | $12,000 | -- |
Source: Public Records
Mortgage History
| Date | Status | Borrower | Loan Amount |
|---|---|---|---|
| Open | Global Rental Property Llc | $18,000 | |
| Previous Owner | Locker Properties Llc | $152,000 |
Source: Public Records
Tax History Compared to Growth
Tax History
| Year | Tax Paid | Tax Assessment Tax Assessment Total Assessment is a certain percentage of the fair market value that is determined by local assessors to be the total taxable value of land and additions on the property. | Land | Improvement |
|---|---|---|---|---|
| 2025 | -- | $16,140 | $4,340 | $11,800 |
| 2024 | -- | $16,140 | $4,340 | $11,800 |
| 2023 | $733 | $12,010 | $3,960 | $8,050 |
| 2022 | $716 | $12,010 | $3,960 | $8,050 |
| 2021 | $724 | $12,010 | $3,960 | $8,050 |
| 2020 | $664 | $9,870 | $3,290 | $6,580 |
| 2019 | $576 | $9,870 | $3,290 | $6,580 |
| 2018 | $586 | $9,870 | $3,290 | $6,580 |
| 2017 | $599 | $9,180 | $3,190 | $5,990 |
| 2016 | $601 | $9,180 | $3,190 | $5,990 |
| 2015 | $438 | $6,620 | $3,190 | $3,430 |
| 2014 | $487 | $6,930 | $3,360 | $3,570 |
| 2013 | $236 | $6,930 | $3,360 | $3,570 |
Source: Public Records
Map
Nearby Homes
- 1023 Wertz Ave SW
- 2711 Blair Place SW
- 1019 Dartmouth Ave SW
- 929 Wertz Ave SW
- 1013 Maryland Ave SW
- 921 Clarendon Ave SW
- 1238 Arlington Ave SW
- 1361 Crescent Rd SW
- 846 Maryland Ave SW
- 1009 Arlington Ave SW
- 3204 14th St SW
- 2416 9th St SW
- 931 Smith Ave SW
- 3029 7th St SW
- 1227 Greenfield Ave SW
- 1547 Alden Ave SW
- 2310 7th St SW
- 1622 Clarendon Ave SW
- 1201 Benskin Ave SW
- 3800 11th St SW
- 1239 Ardmore Ave SW
- 1233 Ardmore Ave SW
- 1243 Ardmore Ave SW
- 1229 Ardmore Ave SW
- 1225 Ardmore Ave SW
- 1234 Wertz Ave SW
- 1230 Wertz Ave SW
- 1246 Wertz Ave SW
- 1242 Wertz Ave SW
- 1228 Wertz Ave SW
- 1234 Ardmore Ave SW
- 1251 Ardmore Ave SW
- 1232 Ardmore Ave SW
- 1240 Ardmore Ave SW
- 1224 Wertz Ave SW
- 1228 Ardmore Ave SW
- 1219 Ardmore Ave SW
- 1250 Wertz Ave SW
- 1224 Ardmore Ave SW
- 1246 Ardmore Ave SW