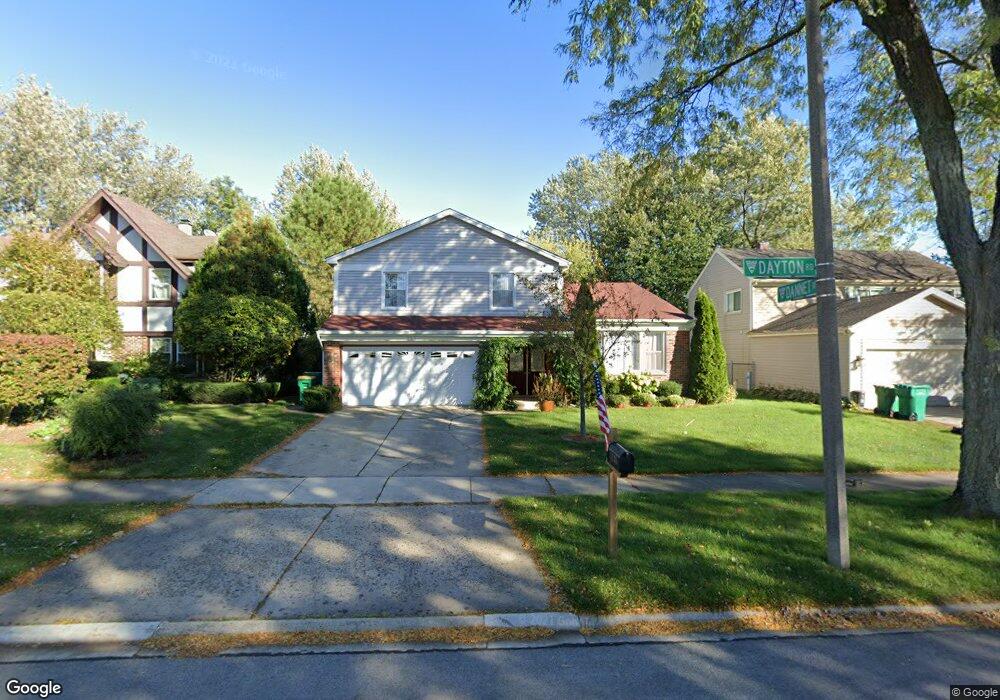
1235 Dayton Rd Buffalo Grove, IL 60089
Prairie Park-Lake County NeighborhoodEstimated Value: $405,000 - $520,000
--
Bed
3
Baths
1,485
Sq Ft
$305/Sq Ft
Est. Value
About This Home
This home is located at 1235 Dayton Rd, Buffalo Grove, IL 60089 and is currently estimated at $452,866, approximately $304 per square foot. 1235 Dayton Rd is a home located in Lake County with nearby schools including Prairie Elementary School, Twin Groves Middle School, and Adlai E Stevenson High School.
Ownership History
Date
Name
Owned For
Owner Type
Purchase Details
Closed on
Dec 14, 2001
Sold by
Kozobrod Anthony and Kozobrod Galina
Bought by
Kozob Anthony and Kozob Galina
Current Estimated Value
Home Financials for this Owner
Home Financials are based on the most recent Mortgage that was taken out on this home.
Original Mortgage
$215,000
Interest Rate
7.26%
Purchase Details
Closed on
Aug 23, 1996
Sold by
Brown Nanette L
Bought by
Kozobrod Anatoliy and Kozobrod Galina
Home Financials for this Owner
Home Financials are based on the most recent Mortgage that was taken out on this home.
Original Mortgage
$198,000
Interest Rate
8.44%
Mortgage Type
Balloon
Create a Home Valuation Report for This Property
The Home Valuation Report is an in-depth analysis detailing your home's value as well as a comparison with similar homes in the area
Home Values in the Area
Average Home Value in this Area
Purchase History
| Date | Buyer | Sale Price | Title Company |
|---|---|---|---|
| Kozob Anthony | -- | -- | |
| Kozobrod Anatoliy | $220,000 | Attorneys Natl Title Network |
Source: Public Records
Mortgage History
| Date | Status | Borrower | Loan Amount |
|---|---|---|---|
| Previous Owner | Kozob Anthony | $215,000 | |
| Previous Owner | Kozobrod Anatoliy | $198,000 |
Source: Public Records
Tax History Compared to Growth
Tax History
| Year | Tax Paid | Tax Assessment Tax Assessment Total Assessment is a certain percentage of the fair market value that is determined by local assessors to be the total taxable value of land and additions on the property. | Land | Improvement |
|---|---|---|---|---|
| 2024 | $11,103 | $123,189 | $33,162 | $90,027 |
| 2023 | $10,553 | $116,238 | $31,291 | $84,947 |
| 2022 | $10,553 | $107,209 | $28,860 | $78,349 |
| 2021 | $9,913 | $106,053 | $28,549 | $77,504 |
| 2020 | $9,913 | $106,414 | $28,646 | $77,768 |
| 2019 | $12,477 | $133,654 | $28,540 | $105,114 |
| 2018 | $6,215 | $120,851 | $28,208 | $92,643 |
| 2017 | $10,672 | $118,031 | $27,550 | $90,481 |
| 2016 | $10,391 | $113,024 | $26,381 | $86,643 |
| 2015 | $10,113 | $105,699 | $24,671 | $81,028 |
| 2014 | $7,652 | $80,348 | $26,496 | $53,852 |
| 2012 | $7,585 | $80,509 | $26,549 | $53,960 |
Source: Public Records
Map
Nearby Homes
- 1315 Gail Dr
- 1027 Courtland Dr Unit 20
- 1327 Larchmont Dr
- 810 Silver Rock Ln
- 760 Checker Dr
- 12 Cloverdale Ct
- 531 Lasalle Ln
- 5107 N Arlington Heights Rd
- 620 Twisted Oak Ln
- 1325 Fairfax Ln
- 5135 Bridlewood Ct
- 938 Hidden Lake Dr
- 1117 Franklin Ln Unit C52
- 630 Woodhollow Ln
- 1272 Sandhurst Dr
- 131 Autumn Ct Unit CT10602
- 5255 Danbury Ct
- 412 Chateau Dr
- 4106 Bob o Link Ln
- 1514 Sumter Dr
- 1245 Dayton Rd
- 1225 Dayton Rd
- 1244 Devonshire Rd
- 1234 Devonshire Rd
- 1255 Dayton Rd
- 1215 Dayton Rd
- 1254 Devonshire Rd
- 796 Dannet Rd
- 797 Dannet Rd Unit 1
- 1205 Dayton Rd
- 1214 Devonshire Rd
- 1265 Dayton Rd
- 1274 Devonshire Rd
- 1214 Dayton Rd
- 800 Dannet Rd
- 1264 Dayton Rd
- 1204 Devonshire Rd
- 1195 Dayton Rd
- 801 Dannet Rd
- 1204 Dayton Rd