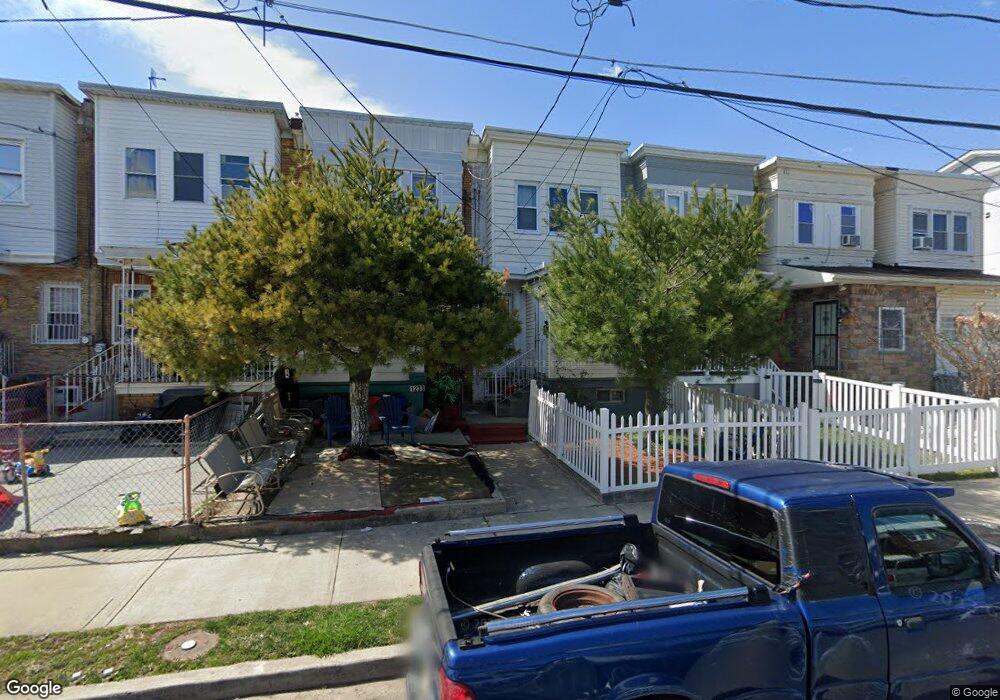
1235 N 21st St Camden, NJ 08105
Cramer Hill NeighborhoodEstimated Value: $99,000 - $111,000
--
Bed
--
Bath
1,040
Sq Ft
$102/Sq Ft
Est. Value
About This Home
This home is located at 1235 N 21st St, Camden, NJ 08105 and is currently estimated at $106,013, approximately $101 per square foot. 1235 N 21st St is a home located in Camden County with nearby schools including Veterans Memorial Middle School, Eastside High School, and Camdens Promise Charter School.
Ownership History
Date
Name
Owned For
Owner Type
Purchase Details
Closed on
May 1, 2018
Sold by
Tiburcio Deivy
Bought by
Jimenez Maritza
Current Estimated Value
Purchase Details
Closed on
Aug 7, 2013
Sold by
Almonte Orlando and Jimenez Maritza
Bought by
Tiburcio Deivy
Purchase Details
Closed on
Aug 15, 2003
Sold by
Perez Guillermo Torres
Bought by
Fortuna Leonidas A
Purchase Details
Closed on
Nov 8, 2001
Sold by
Caquias Lucy M
Bought by
Jimenez Ramon
Purchase Details
Closed on
Nov 1, 2001
Sold by
Pagan Ana L
Bought by
Jimenez Maria G
Create a Home Valuation Report for This Property
The Home Valuation Report is an in-depth analysis detailing your home's value as well as a comparison with similar homes in the area
Home Values in the Area
Average Home Value in this Area
Purchase History
| Date | Buyer | Sale Price | Title Company |
|---|---|---|---|
| Jimenez Maritza | -- | None Available | |
| Tiburcio Deivy | -- | None Available | |
| Fortuna Leonidas A | $35,000 | -- | |
| Jimenez Ramon | $30,000 | -- | |
| Jimenez Maria G | $16,000 | -- |
Source: Public Records
Tax History Compared to Growth
Tax History
| Year | Tax Paid | Tax Assessment Tax Assessment Total Assessment is a certain percentage of the fair market value that is determined by local assessors to be the total taxable value of land and additions on the property. | Land | Improvement |
|---|---|---|---|---|
| 2025 | $2,073 | $58,500 | $16,800 | $41,700 |
| 2024 | $2,004 | $58,500 | $16,800 | $41,700 |
| 2023 | $2,004 | $58,500 | $16,800 | $41,700 |
| 2022 | $1,966 | $58,500 | $16,800 | $41,700 |
| 2021 | $1,959 | $58,500 | $16,800 | $41,700 |
| 2020 | $1,860 | $58,500 | $16,800 | $41,700 |
| 2019 | $1,781 | $58,500 | $16,800 | $41,700 |
| 2018 | $1,772 | $58,500 | $16,800 | $41,700 |
| 2017 | $1,729 | $58,500 | $16,800 | $41,700 |
| 2016 | $1,674 | $58,500 | $16,800 | $41,700 |
| 2015 | $1,611 | $58,500 | $16,800 | $41,700 |
| 2014 | $1,572 | $58,500 | $16,800 | $41,700 |
Source: Public Records
Map
Nearby Homes