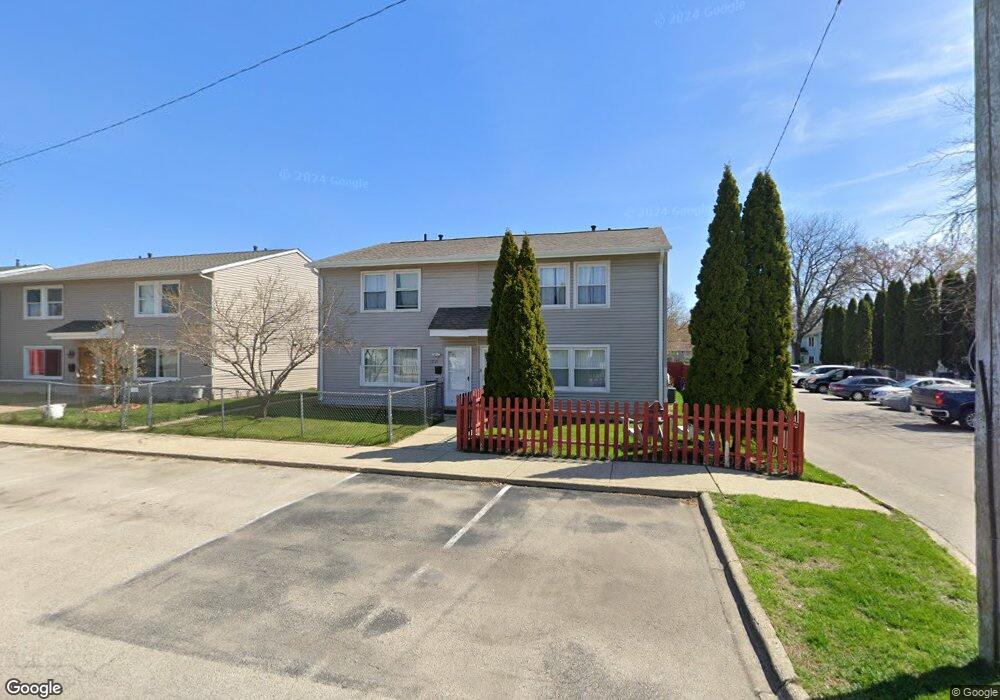
1235 S Fulton Ave Waukegan, IL 60085
Lewis Glenn NeighborhoodEstimated Value: $154,000 - $181,399
4
Beds
2
Baths
1,280
Sq Ft
$129/Sq Ft
Est. Value
About This Home
This home is located at 1235 S Fulton Ave, Waukegan, IL 60085 and is currently estimated at $164,850, approximately $128 per square foot. 1235 S Fulton Ave is a home located in Lake County with nearby schools including Clearview Elementary School, John R Lewis Middle School, and Waukegan High School.
Ownership History
Date
Name
Owned For
Owner Type
Purchase Details
Closed on
Sep 29, 2023
Sold by
Zavala Manuel
Bought by
Figueroa Miguel Angel
Current Estimated Value
Home Financials for this Owner
Home Financials are based on the most recent Mortgage that was taken out on this home.
Original Mortgage
$60,000
Outstanding Balance
$58,833
Interest Rate
7.18%
Mortgage Type
New Conventional
Estimated Equity
$106,017
Purchase Details
Closed on
Sep 9, 2004
Sold by
Zavala Ramiro
Bought by
Zavala Manuel
Home Financials for this Owner
Home Financials are based on the most recent Mortgage that was taken out on this home.
Original Mortgage
$85,000
Interest Rate
7.7%
Mortgage Type
Unknown
Purchase Details
Closed on
Jul 2, 2001
Sold by
Lasalle Bank National Assn
Bought by
Zavala Ramiro
Home Financials for this Owner
Home Financials are based on the most recent Mortgage that was taken out on this home.
Original Mortgage
$61,042
Interest Rate
7.28%
Mortgage Type
FHA
Create a Home Valuation Report for This Property
The Home Valuation Report is an in-depth analysis detailing your home's value as well as a comparison with similar homes in the area
Home Values in the Area
Average Home Value in this Area
Purchase History
| Date | Buyer | Sale Price | Title Company |
|---|---|---|---|
| Figueroa Miguel Angel | $100,000 | Chicago Title | |
| Zavala Manuel | -- | -- | |
| Zavala Ramiro | $62,000 | -- |
Source: Public Records
Mortgage History
| Date | Status | Borrower | Loan Amount |
|---|---|---|---|
| Open | Figueroa Miguel Angel | $60,000 | |
| Previous Owner | Zavala Manuel | $85,000 | |
| Previous Owner | Zavala Ramiro | $61,042 |
Source: Public Records
Tax History Compared to Growth
Tax History
| Year | Tax Paid | Tax Assessment Tax Assessment Total Assessment is a certain percentage of the fair market value that is determined by local assessors to be the total taxable value of land and additions on the property. | Land | Improvement |
|---|---|---|---|---|
| 2024 | $3,305 | $41,714 | $5,978 | $35,736 |
| 2023 | $2,720 | $35,723 | $5,119 | $30,604 |
| 2022 | $2,720 | $28,202 | $3,344 | $24,858 |
| 2021 | $2,571 | $25,074 | $2,956 | $22,118 |
| 2020 | $2,605 | $23,360 | $2,754 | $20,606 |
| 2019 | $2,622 | $21,406 | $2,524 | $18,882 |
| 2018 | $2,766 | $21,662 | $2,857 | $18,805 |
| 2017 | $2,690 | $19,165 | $2,528 | $16,637 |
| 2016 | $2,542 | $16,654 | $2,197 | $14,457 |
| 2015 | $2,457 | $14,905 | $1,966 | $12,939 |
| 2014 | $2,675 | $16,056 | $2,010 | $14,046 |
| 2012 | $3,302 | $17,395 | $2,178 | $15,217 |
Source: Public Records
Map
Nearby Homes
- 1712 11th St
- 1511 14th St
- 1521 Seymour Ave
- 1244 Victoria Ave
- 1617 Grove Ave
- 819 S Fulton Ave
- 1535 Glenn Dr
- 1423 Victoria Ave
- 1210 Park Ave
- 1542 Victoria Ave
- 720 13th St
- 1301 Park Ave
- 1641 Jackson St
- 724 10th St
- 1101 Adams St
- 1815 Hervey Ave
- 1102 Wadsworth Ave
- 1702 Lincoln St
- 815 Prescott St
- 842 Wadsworth Ave
- 1231 S Fulton Ave
- 1239 S Fulton Ave
- 1227 S Fulton Ave
- 1223 S Fulton Ave
- 1236 Collier Ct
- 1240 Collier Ct
- 1232 Collier Ct
- 1219 S Fulton Ave
- 1228 Collier Ct
- 1224 Collier Ct
- 1234 S Fulton Ave
- 1238 S Fulton Ave
- 1230 S Fulton Ave
- 1215 S Fulton Ave
- 1623 Richard e Bush Ct
- 1625 Richard e Bush Ct
- 1621 Richard e Bush Ct
- 1226 S Fulton Ave
- 1619 Richard e Bush Ct
- 1627 Richard e Bush Ct