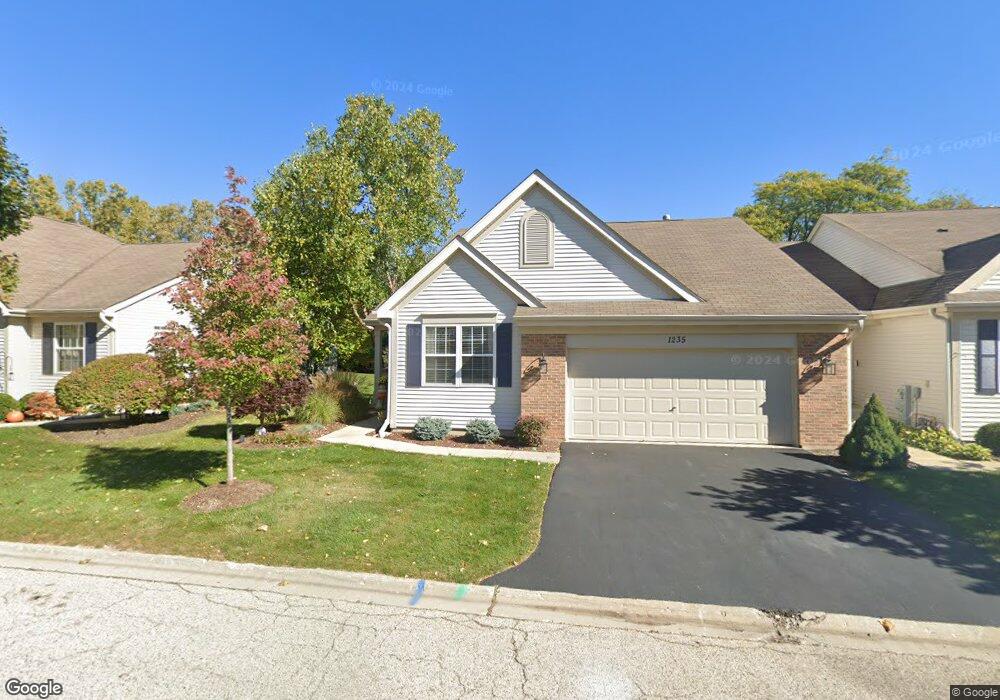
1235 Shagbark Ct Unit 361 Fox Lake, IL 60020
Northeast Fox Lake NeighborhoodEstimated Value: $281,000 - $336,000
3
Beds
2
Baths
1,308
Sq Ft
$229/Sq Ft
Est. Value
About This Home
This home is located at 1235 Shagbark Ct Unit 361, Fox Lake, IL 60020 and is currently estimated at $299,825, approximately $229 per square foot. 1235 Shagbark Ct Unit 361 is a home located in Lake County with nearby schools including Lotus Elementary School, Stanton Middle School, and Grant Community High School.
Ownership History
Date
Name
Owned For
Owner Type
Purchase Details
Closed on
Aug 6, 2020
Sold by
Hauca Gregory J and Hauca Anne L
Bought by
Hauca Gregory J and Hauca Anne L
Current Estimated Value
Purchase Details
Closed on
Jun 30, 2003
Sold by
Nudo Bridger Michael J and Nudo Bridger Nina
Bought by
Hauca Gregory J and Hauca Anne L
Home Financials for this Owner
Home Financials are based on the most recent Mortgage that was taken out on this home.
Original Mortgage
$188,000
Interest Rate
5.36%
Mortgage Type
Unknown
Purchase Details
Closed on
Jul 19, 2002
Sold by
Remington At Woodland Green Llc
Bought by
Bridger Michael J and Nudo Bridger Nina
Home Financials for this Owner
Home Financials are based on the most recent Mortgage that was taken out on this home.
Original Mortgage
$200,320
Interest Rate
5.87%
Purchase Details
Closed on
Apr 9, 2001
Sold by
Amalgamated Bank Of Chicago
Bought by
Remington At Woodland Green Llc
Create a Home Valuation Report for This Property
The Home Valuation Report is an in-depth analysis detailing your home's value as well as a comparison with similar homes in the area
Home Values in the Area
Average Home Value in this Area
Purchase History
| Date | Buyer | Sale Price | Title Company |
|---|---|---|---|
| Hauca Gregory J | -- | Attorney | |
| Hauca Gregory J | $275,000 | First American Title | |
| Bridger Michael J | $234,000 | First American Title | |
| Remington At Woodland Green Llc | -- | -- |
Source: Public Records
Mortgage History
| Date | Status | Borrower | Loan Amount |
|---|---|---|---|
| Closed | Hauca Gregory J | $188,000 | |
| Previous Owner | Bridger Michael J | $200,320 |
Source: Public Records
Tax History Compared to Growth
Tax History
| Year | Tax Paid | Tax Assessment Tax Assessment Total Assessment is a certain percentage of the fair market value that is determined by local assessors to be the total taxable value of land and additions on the property. | Land | Improvement |
|---|---|---|---|---|
| 2024 | $5,645 | $81,506 | $7,604 | $73,902 |
| 2023 | $6,903 | $72,982 | $6,809 | $66,173 |
| 2022 | $6,903 | $82,655 | $13,909 | $68,746 |
| 2021 | $6,594 | $77,125 | $12,978 | $64,147 |
| 2020 | $6,502 | $74,996 | $12,620 | $62,376 |
| 2019 | $6,172 | $71,718 | $12,068 | $59,650 |
| 2018 | $6,342 | $72,135 | $3,723 | $68,412 |
| 2017 | $6,275 | $68,661 | $3,544 | $65,117 |
| 2016 | $6,658 | $66,262 | $3,420 | $62,842 |
| 2015 | $6,598 | $64,577 | $3,333 | $61,244 |
| 2014 | $4,002 | $42,224 | $4,484 | $37,740 |
| 2012 | $4,002 | $44,211 | $4,484 | $39,727 |
Source: Public Records
Map
Nearby Homes
- 1045 Fairway Dr Unit 72
- 1047 Fairway Dr Unit 71
- 7216 Oxford Cir Unit 230
- 7302 Dunwood Ct Unit 115
- 7108 Granada Ln Unit 280
- 7314 Chevy Chase Ct Unit 55
- 7003 Bogie Ln
- 13 Saint Thomas Colony Unit 7
- 56 Vail Colony Unit 5
- 52 Oak Hill Colony Unit 4
- 40 Bermuda Colony Unit 7
- 58 Vail Colony Unit 11
- 16 Saint Thomas Colony Unit 6
- 59 Vail Colony Unit 3
- 36 Bermuda Colony Unit 6
- 7220 State Park Rd
- 45 Nassau Colony Unit 4
- 530 Main Street Rd
- 8215 Balsam Ct
- 535 Deer Run
- 1233 Shagbark Ct Unit 362
- 1237 Shagbark Ct Unit 353
- 1231 Shagbark Ct Unit 363
- 1239 Shagbark Ct Unit 352
- 1236 Shagbark Ct Unit 392
- 1238 Shagbark Ct Unit 393
- 1234 Shagbark Ct Unit 391
- 1227 Shagbark Ct
- 1241 Shagbark Ct Unit 351
- 1225 Shagbark Ct Unit 372
- 1127 N Oakwood Dr Unit 401
- 1223 Shagbark Ct Unit 373
- 1125 N Oakwood Dr Unit 402
- 1221 Shagbark Ct Unit 381
- 1126 N Oakwood Dr
- 1219 Shagbark Ct Unit 382
- 1219 Shagbark Ct Unit 1219
- 1124 N Oakwood Dr Unit 143
- 1217 Shagbark Ct Unit 383
- 1122 N Oakwood Dr Unit 142