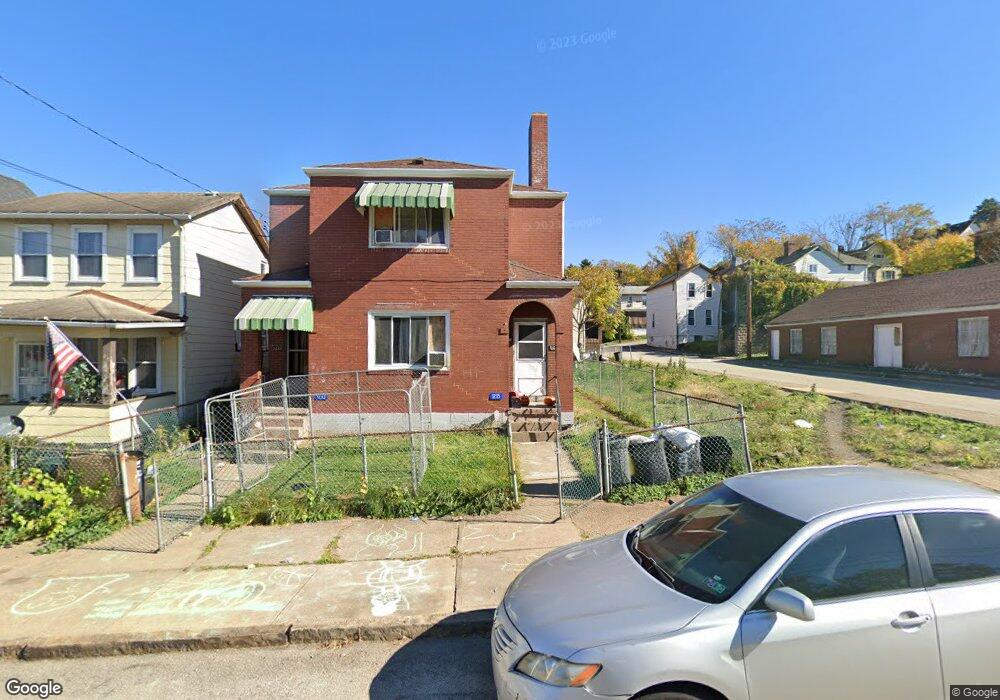
1235 Soles St McKeesport, PA 15132
Estimated Value: $56,000 - $114,000
4
Beds
2
Baths
2,136
Sq Ft
$39/Sq Ft
Est. Value
About This Home
This home is located at 1235 Soles St, McKeesport, PA 15132 and is currently estimated at $82,956, approximately $38 per square foot. 1235 Soles St is a home located in Allegheny County with nearby schools including Mckeesport Area Senior High School, Propel Schools - McKeesport, and Mary of Nazareth Catholic School.
Ownership History
Date
Name
Owned For
Owner Type
Purchase Details
Closed on
Aug 27, 2007
Sold by
Weston Erik A
Bought by
Cash Dennis
Current Estimated Value
Home Financials for this Owner
Home Financials are based on the most recent Mortgage that was taken out on this home.
Original Mortgage
$27,000
Outstanding Balance
$17,208
Interest Rate
6.7%
Mortgage Type
New Conventional
Estimated Equity
$65,748
Purchase Details
Closed on
Aug 2, 1996
Sold by
Yuna Jim J and Yuna Elaine A
Bought by
Yuna Elaine A and Gessner Elaine A
Create a Home Valuation Report for This Property
The Home Valuation Report is an in-depth analysis detailing your home's value as well as a comparison with similar homes in the area
Home Values in the Area
Average Home Value in this Area
Purchase History
| Date | Buyer | Sale Price | Title Company |
|---|---|---|---|
| Cash Dennis | $27,000 | -- | |
| Yuna Elaine A | -- | -- |
Source: Public Records
Mortgage History
| Date | Status | Borrower | Loan Amount |
|---|---|---|---|
| Open | Cash Dennis | $27,000 |
Source: Public Records
Tax History Compared to Growth
Tax History
| Year | Tax Paid | Tax Assessment Tax Assessment Total Assessment is a certain percentage of the fair market value that is determined by local assessors to be the total taxable value of land and additions on the property. | Land | Improvement |
|---|---|---|---|---|
| 2025 | $2,143 | $46,400 | $4,000 | $42,400 |
| 2024 | $2,143 | $46,400 | $4,000 | $42,400 |
| 2023 | $2,143 | $46,400 | $4,000 | $42,400 |
| 2022 | $2,143 | $46,400 | $4,000 | $42,400 |
| 2021 | $219 | $46,400 | $4,000 | $42,400 |
| 2020 | $2,106 | $46,400 | $4,000 | $42,400 |
| 2019 | $1,414 | $46,400 | $4,000 | $42,400 |
| 2018 | $219 | $46,400 | $4,000 | $42,400 |
| 2017 | $1,287 | $46,400 | $4,000 | $42,400 |
| 2016 | $219 | $46,400 | $4,000 | $42,400 |
| 2015 | $219 | $46,400 | $4,000 | $42,400 |
| 2014 | $948 | $46,400 | $4,000 | $42,400 |
Source: Public Records
Map
Nearby Homes