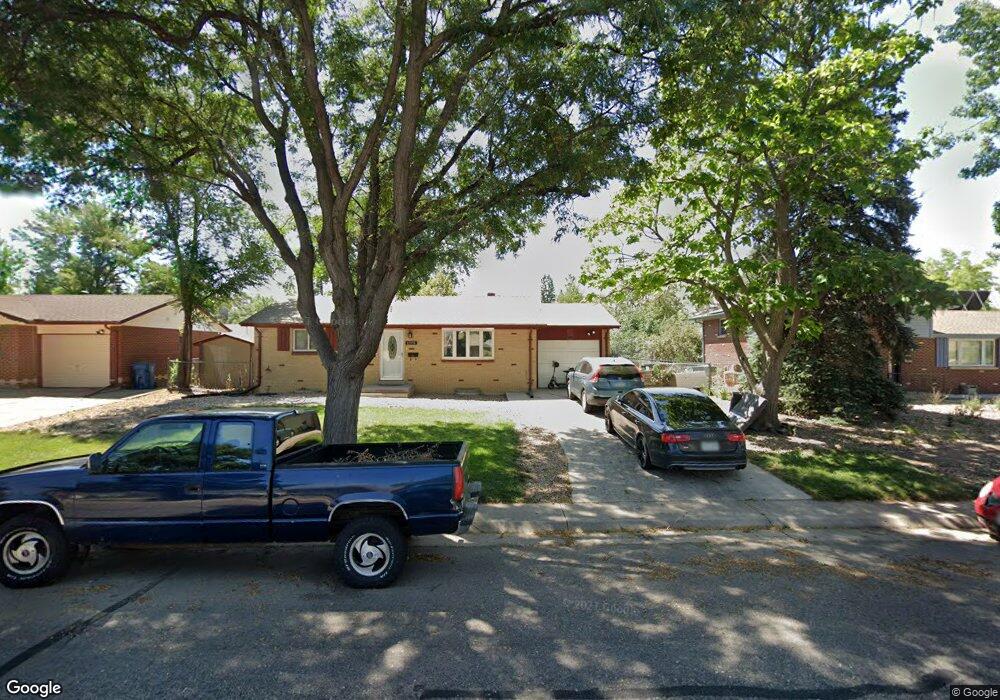
12350 E Nevada Ave Aurora, CO 80012
Aurora Hills NeighborhoodEstimated Value: $422,000 - $495,000
3
Beds
2
Baths
2,106
Sq Ft
$211/Sq Ft
Est. Value
About This Home
This home is located at 12350 E Nevada Ave, Aurora, CO 80012 and is currently estimated at $443,491, approximately $210 per square foot. 12350 E Nevada Ave is a home located in Arapahoe County with nearby schools including Virginia Court Elementary School, Aurora Hills Middle School, and Gateway High School.
Ownership History
Date
Name
Owned For
Owner Type
Purchase Details
Closed on
Jan 31, 2017
Sold by
Pitts Randy T
Bought by
Pitts Tamera Dee Vandyne
Current Estimated Value
Purchase Details
Closed on
Mar 23, 2015
Sold by
Norris Cameron J
Bought by
Vandyne Pitts Randy T and Vandyne Pitts Tamera Dee
Purchase Details
Closed on
May 27, 2005
Sold by
Freidhoff Peter J
Bought by
Norris Cameron J
Home Financials for this Owner
Home Financials are based on the most recent Mortgage that was taken out on this home.
Original Mortgage
$140,000
Interest Rate
5.37%
Mortgage Type
Purchase Money Mortgage
Purchase Details
Closed on
Dec 27, 1991
Sold by
Drake Michael L and Drake Elizabeth Ann
Bought by
Freidhoff Peter J
Purchase Details
Closed on
Dec 31, 1990
Sold by
Conversion Arapco
Bought by
Drake Michael L and Drake Elizabeth Ann
Purchase Details
Closed on
Jul 1, 1980
Sold by
Conversion Arapco
Bought by
Conversion Arapco
Purchase Details
Closed on
Jul 4, 1776
Bought by
Conversion Arapco
Create a Home Valuation Report for This Property
The Home Valuation Report is an in-depth analysis detailing your home's value as well as a comparison with similar homes in the area
Home Values in the Area
Average Home Value in this Area
Purchase History
| Date | Buyer | Sale Price | Title Company |
|---|---|---|---|
| Pitts Tamera Dee Vandyne | -- | None Available | |
| Vandyne Pitts Randy T | $225,000 | Canyon Title | |
| Norris Cameron J | $175,000 | Chicago Title Co | |
| Freidhoff Peter J | -- | -- | |
| Drake Michael L | -- | -- | |
| Conversion Arapco | -- | -- | |
| Conversion Arapco | -- | -- |
Source: Public Records
Mortgage History
| Date | Status | Borrower | Loan Amount |
|---|---|---|---|
| Previous Owner | Norris Cameron J | $140,000 |
Source: Public Records
Tax History
| Year | Tax Paid | Tax Assessment Tax Assessment Total Assessment is a certain percentage of the fair market value that is determined by local assessors to be the total taxable value of land and additions on the property. | Land | Improvement |
|---|---|---|---|---|
| 2025 | $2,865 | $27,919 | -- | -- |
| 2024 | $2,779 | $29,902 | -- | -- |
| 2023 | $2,779 | $29,902 | $0 | $0 |
| 2022 | $2,361 | $23,512 | $0 | $0 |
| 2021 | $2,437 | $23,512 | $0 | $0 |
| 2020 | $2,222 | $21,343 | $0 | $0 |
| 2019 | $2,210 | $21,343 | $0 | $0 |
| 2018 | $2,015 | $19,058 | $0 | $0 |
| 2017 | $1,753 | $19,058 | $0 | $0 |
| 2016 | $1,188 | $12,640 | $0 | $0 |
| 2015 | $1,146 | $12,640 | $0 | $0 |
| 2014 | -- | $10,348 | $0 | $0 |
| 2013 | -- | $9,490 | $0 | $0 |
Source: Public Records
Map
Nearby Homes
- 12403 E Nevada Ave
- 12024 E Maple Ave
- 12446 E Alaska Place
- 12466 E Alaska Place
- 373 S Troy St
- 12080 E Maple Ave
- 11750 E Cedar Ave
- 12802 E Nevada Cir
- 11688 E Cedar Ave
- 11675 E Alaska Ave
- 628 S Oswego Ct
- 11623 E Virginia Dr
- 126 S Nome St
- 365 S Ursula Way
- 128 S Moline St
- 46 S Nome St
- 88 S Moline St
- 4 Nome Way Unit D
- 64 Nome Way Unit A
- 13 Nome Way Unit A
- 12300 E Nevada Ave
- 12390 E Nevada Ave
- 12359 E Nevada Place
- 12309 E Nevada Place
- 12399 E Nevada Place
- 12258 E Nevada Ave
- 12257 E Nevada Place
- 12351 E Nevada Ave
- 12301 E Nevada Ave
- 12208 E Nevada Ave
- 12391 E Nevada Ave
- 318 S Racine St
- 12259 E Nevada Ave
- 12207 E Nevada Place
- 328 S Racine St
- 12358 E Nevada Place
- 12308 E Nevada Place
- 338 S Racine St
- 12156 E Nevada Ave
- 12209 E Nevada Ave
Your Personal Tour Guide
Ask me questions while you tour the home.