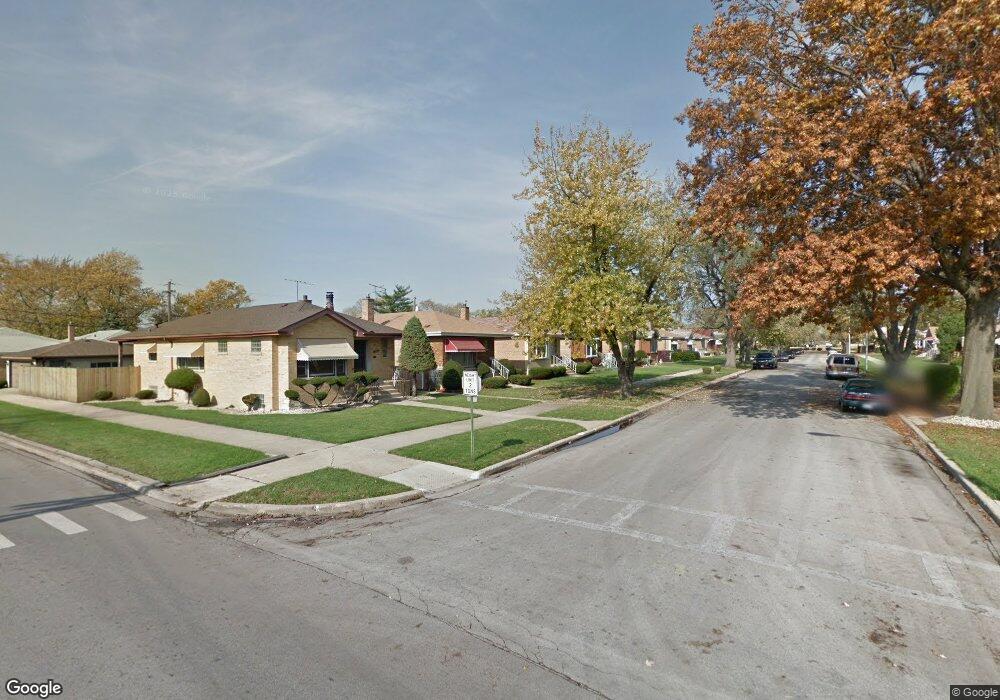
12352 S Ada St Calumet Park, IL 60827
Estimated Value: $173,000 - $290,000
3
Beds
2
Baths
1,144
Sq Ft
$187/Sq Ft
Est. Value
About This Home
This home is located at 12352 S Ada St, Calumet Park, IL 60827 and is currently estimated at $213,500, approximately $186 per square foot. 12352 S Ada St is a home located in Cook County with nearby schools including Burr Oak Academy, Calumet Middle School, and Harold L. Richards High School.
Ownership History
Date
Name
Owned For
Owner Type
Purchase Details
Closed on
Nov 27, 2001
Sold by
J A P Unity Home Inc
Bought by
Barnes Tracey
Current Estimated Value
Home Financials for this Owner
Home Financials are based on the most recent Mortgage that was taken out on this home.
Original Mortgage
$98,300
Outstanding Balance
$48,367
Interest Rate
10.15%
Estimated Equity
$165,133
Purchase Details
Closed on
Mar 25, 2001
Sold by
Hud
Bought by
J A P Unity Hm Inc
Home Financials for this Owner
Home Financials are based on the most recent Mortgage that was taken out on this home.
Original Mortgage
$173,000
Interest Rate
6.95%
Purchase Details
Closed on
Jun 19, 2000
Sold by
Lakes Ozzie
Bought by
Hud
Purchase Details
Closed on
Jul 21, 1995
Sold by
Hubbard Johnnie B and Hubbard Rosie L
Bought by
Lakes Ozzie
Home Financials for this Owner
Home Financials are based on the most recent Mortgage that was taken out on this home.
Original Mortgage
$91,871
Interest Rate
7.51%
Mortgage Type
FHA
Create a Home Valuation Report for This Property
The Home Valuation Report is an in-depth analysis detailing your home's value as well as a comparison with similar homes in the area
Home Values in the Area
Average Home Value in this Area
Purchase History
| Date | Buyer | Sale Price | Title Company |
|---|---|---|---|
| Barnes Tracey | $103,000 | -- | |
| J A P Unity Hm Inc | -- | Stewart Title Company | |
| Hud | -- | -- | |
| Lakes Ozzie | $92,000 | -- |
Source: Public Records
Mortgage History
| Date | Status | Borrower | Loan Amount |
|---|---|---|---|
| Open | Barnes Tracey | $98,300 | |
| Previous Owner | J A P Unity Hm Inc | $173,000 | |
| Previous Owner | Lakes Ozzie | $91,871 |
Source: Public Records
Tax History Compared to Growth
Tax History
| Year | Tax Paid | Tax Assessment Tax Assessment Total Assessment is a certain percentage of the fair market value that is determined by local assessors to be the total taxable value of land and additions on the property. | Land | Improvement |
|---|---|---|---|---|
| 2024 | $5,372 | $14,000 | $2,625 | $11,375 |
| 2023 | $3,853 | $14,000 | $2,625 | $11,375 |
| 2022 | $3,853 | $9,420 | $2,297 | $7,123 |
| 2021 | $3,771 | $9,419 | $2,296 | $7,123 |
| 2020 | $3,848 | $9,419 | $2,296 | $7,123 |
| 2019 | $4,588 | $11,461 | $2,078 | $9,383 |
| 2018 | $4,658 | $11,461 | $2,078 | $9,383 |
| 2017 | $4,524 | $11,461 | $2,078 | $9,383 |
| 2016 | $3,875 | $9,758 | $1,859 | $7,899 |
| 2015 | $3,650 | $9,758 | $1,859 | $7,899 |
| 2014 | $3,721 | $9,758 | $1,859 | $7,899 |
| 2013 | $3,855 | $11,265 | $1,859 | $9,406 |
Source: Public Records
Map
Nearby Homes
- 12437 S Throop St
- 1415 W 123rd St
- 12226 S Elizabeth St
- 12219 S Throop St
- 1434 W 123rd St
- 12512 S Loomis St
- 12312 S May St
- 12529 S Loomis St
- 12138 S Elizabeth St
- 12420 S Aberdeen St
- 12536 S Bishop St
- 12250 S Aberdeen St
- 12130 S Racine Ave
- 1541 W Asher St Unit 10D
- 12128 S Bishop St
- 12328 S Carpenter St
- 12416 S Carpenter St
- 12629 S Throop St
- 12401 S Carpenter St
- 12216 S Carpenter St
- 12354 S Ada St
- 12350 S Ada St
- 12360 S Ada St
- 12348 S Ada St
- 12344 S Ada St
- 12340 S Ada St
- 12353 S Loomis St
- 12355 S Loomis St
- 12351 S Loomis St
- 12361 S Loomis St
- 12349 S Loomis St
- 12336 S Ada St
- 12345 S Loomis St
- 12400 S Ada St
- 12341 S Ada St
- 12343 S Ada St
- 12339 S Ada St
- 12341 S Loomis St
- 12335 S Ada St
- 12345 S Ada St