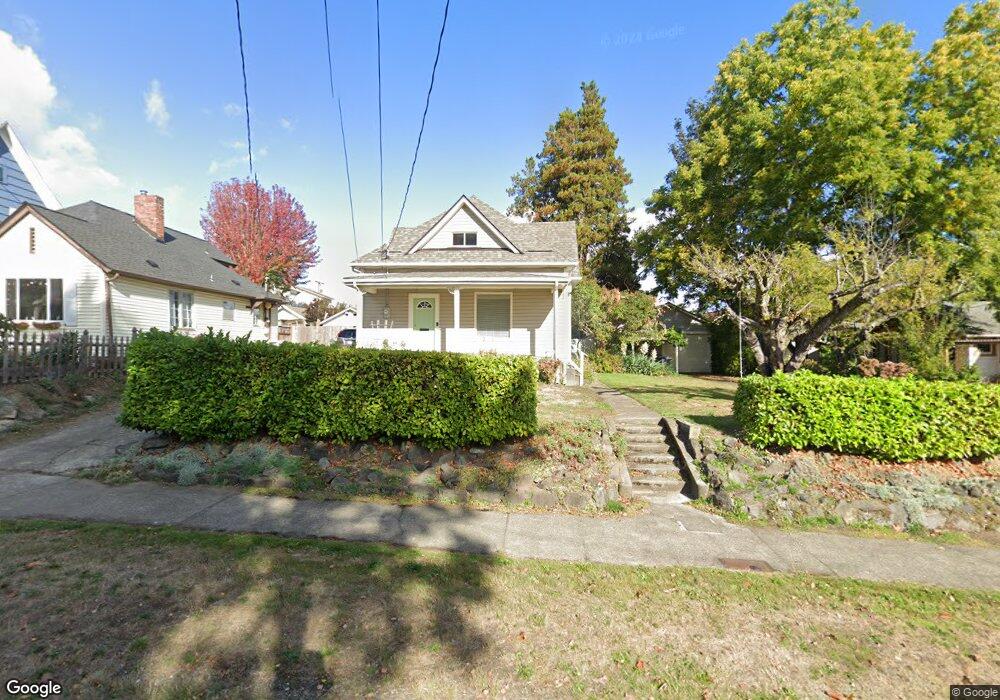
1236 8th St Bremerton, WA 98337
Estimated Value: $409,000 - $443,691
3
Beds
2
Baths
1,396
Sq Ft
$304/Sq Ft
Est. Value
About This Home
This home is located at 1236 8th St, Bremerton, WA 98337 and is currently estimated at $424,173, approximately $303 per square foot. 1236 8th St is a home located in Kitsap County with nearby schools including Naval Avenue Elementary School, Mountain View Middle School, and Bremerton High School.
Ownership History
Date
Name
Owned For
Owner Type
Purchase Details
Closed on
Feb 11, 2003
Sold by
Hud
Bought by
Morse Julie A
Current Estimated Value
Home Financials for this Owner
Home Financials are based on the most recent Mortgage that was taken out on this home.
Original Mortgage
$95,095
Interest Rate
5.78%
Mortgage Type
FHA
Purchase Details
Closed on
Dec 13, 2002
Sold by
Alliance Mortgage Corp
Bought by
Hud
Home Financials for this Owner
Home Financials are based on the most recent Mortgage that was taken out on this home.
Original Mortgage
$95,095
Interest Rate
5.78%
Mortgage Type
FHA
Purchase Details
Closed on
Aug 26, 2002
Sold by
Whitlock Barbara L and Graf Brian E
Bought by
Alliance Mortgage Corp
Create a Home Valuation Report for This Property
The Home Valuation Report is an in-depth analysis detailing your home's value as well as a comparison with similar homes in the area
Home Values in the Area
Average Home Value in this Area
Purchase History
| Date | Buyer | Sale Price | Title Company |
|---|---|---|---|
| Morse Julie A | -- | First American Title Ins | |
| Hud | -- | First American Title Ins | |
| Alliance Mortgage Corp | $85,072 | First American Title Ins |
Source: Public Records
Mortgage History
| Date | Status | Borrower | Loan Amount |
|---|---|---|---|
| Previous Owner | Morse Julie A | $95,095 | |
| Closed | Morse Julie A | $43,500 |
Source: Public Records
Tax History Compared to Growth
Tax History
| Year | Tax Paid | Tax Assessment Tax Assessment Total Assessment is a certain percentage of the fair market value that is determined by local assessors to be the total taxable value of land and additions on the property. | Land | Improvement |
|---|---|---|---|---|
| 2026 | $3,494 | $396,040 | $81,800 | $314,240 |
| 2025 | $3,494 | $396,040 | $81,800 | $314,240 |
| 2024 | $3,371 | $396,040 | $81,800 | $314,240 |
| 2023 | $3,485 | $396,040 | $81,800 | $314,240 |
| 2022 | $3,256 | $332,690 | $68,170 | $264,520 |
| 2021 | $3,013 | $281,750 | $51,410 | $230,340 |
| 2020 | $2,809 | $262,480 | $47,580 | $214,900 |
| 2019 | $2,438 | $236,010 | $42,470 | $193,540 |
| 2018 | $2,576 | $165,060 | $31,930 | $133,130 |
| 2017 | $2,161 | $165,060 | $31,930 | $133,130 |
| 2016 | $2,025 | $146,370 | $28,010 | $118,360 |
| 2015 | $1,816 | $130,570 | $30,460 | $100,110 |
| 2014 | -- | $125,300 | $30,460 | $94,840 |
| 2013 | -- | $133,130 | $32,150 | $100,980 |
Source: Public Records
Map
Nearby Homes