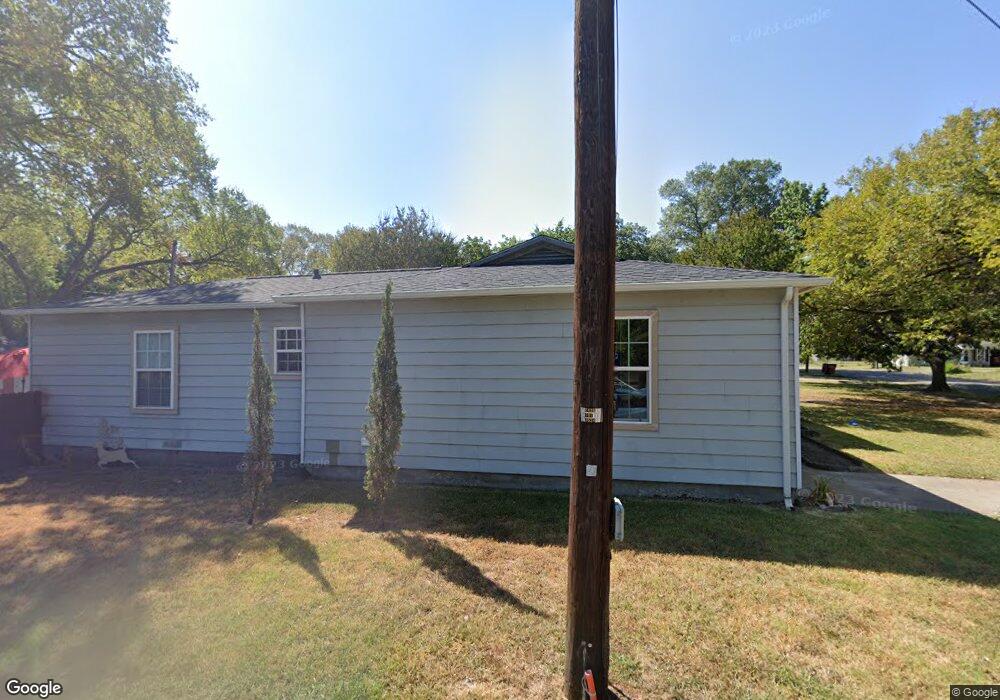
1236 Pecan St Bonham, TX 75418
Estimated Value: $176,217 - $212,000
--
Bed
1
Bath
1,522
Sq Ft
$130/Sq Ft
Est. Value
About This Home
This home is located at 1236 Pecan St, Bonham, TX 75418 and is currently estimated at $197,304, approximately $129 per square foot. 1236 Pecan St is a home located in Fannin County with nearby schools including Finley-Oates Elementary School, LH Rather Jr High School, and Morning Star Academy.
Ownership History
Date
Name
Owned For
Owner Type
Purchase Details
Closed on
Aug 25, 2023
Sold by
Gilbert & Sue Welch Family Revocable Liv
Bought by
Zuniga Ricardo and Hernandez Maria F
Current Estimated Value
Home Financials for this Owner
Home Financials are based on the most recent Mortgage that was taken out on this home.
Original Mortgage
$149,250
Outstanding Balance
$145,800
Interest Rate
6.96%
Mortgage Type
Credit Line Revolving
Estimated Equity
$51,504
Create a Home Valuation Report for This Property
The Home Valuation Report is an in-depth analysis detailing your home's value as well as a comparison with similar homes in the area
Home Values in the Area
Average Home Value in this Area
Purchase History
| Date | Buyer | Sale Price | Title Company |
|---|---|---|---|
| Zuniga Ricardo | -- | Main Street Title |
Source: Public Records
Mortgage History
| Date | Status | Borrower | Loan Amount |
|---|---|---|---|
| Open | Zuniga Ricardo | $149,250 |
Source: Public Records
Tax History Compared to Growth
Tax History
| Year | Tax Paid | Tax Assessment Tax Assessment Total Assessment is a certain percentage of the fair market value that is determined by local assessors to be the total taxable value of land and additions on the property. | Land | Improvement |
|---|---|---|---|---|
| 2025 | $2,287 | $167,720 | $49,920 | $117,800 |
| 2024 | $2,287 | $169,920 | $48,000 | $121,920 |
| 2023 | $3,260 | $165,390 | $44,160 | $121,230 |
| 2022 | $3,306 | $150,320 | $31,200 | $119,120 |
| 2021 | $1,859 | $73,560 | $14,880 | $58,680 |
| 2020 | $1,655 | $64,760 | $12,000 | $52,760 |
| 2019 | $1,618 | $60,890 | $7,080 | $53,810 |
| 2018 | $1,415 | $53,330 | $7,080 | $46,250 |
| 2017 | $1,363 | $53,340 | $6,840 | $46,500 |
| 2016 | $1,344 | $52,600 | $6,840 | $45,760 |
| 2015 | -- | $48,540 | $6,600 | $41,940 |
| 2014 | -- | $45,310 | $6,480 | $38,830 |
Source: Public Records
Map
Nearby Homes