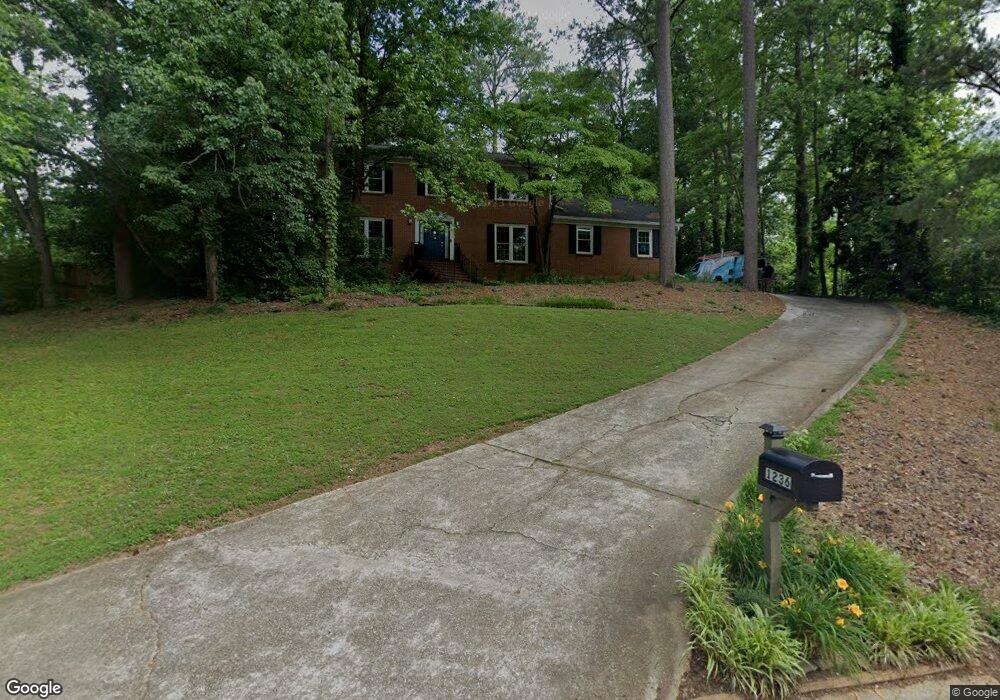
1236 Tred Avon Way SW Unit 2 Lilburn, GA 30047
Estimated Value: $410,446 - $425,000
4
Beds
3
Baths
2,314
Sq Ft
$181/Sq Ft
Est. Value
About This Home
This home is located at 1236 Tred Avon Way SW Unit 2, Lilburn, GA 30047 and is currently estimated at $418,612, approximately $180 per square foot. 1236 Tred Avon Way SW Unit 2 is a home located in Gwinnett County with nearby schools including Camp Creek Elementary School, Trickum Middle School, and Parkview High School.
Ownership History
Date
Name
Owned For
Owner Type
Purchase Details
Closed on
Jun 19, 2017
Sold by
Kotter Lisa A
Bought by
Callaway Joshua
Current Estimated Value
Home Financials for this Owner
Home Financials are based on the most recent Mortgage that was taken out on this home.
Original Mortgage
$245,471
Outstanding Balance
$205,633
Interest Rate
4.37%
Mortgage Type
FHA
Estimated Equity
$212,979
Purchase Details
Closed on
Oct 31, 2006
Sold by
Biscan Dennis C
Bought by
Kotter Lisa A
Home Financials for this Owner
Home Financials are based on the most recent Mortgage that was taken out on this home.
Original Mortgage
$156,750
Interest Rate
9.1%
Mortgage Type
New Conventional
Purchase Details
Closed on
Sep 22, 2006
Sold by
Yelton Carolyn W
Bought by
Biscan Dennis C
Home Financials for this Owner
Home Financials are based on the most recent Mortgage that was taken out on this home.
Original Mortgage
$156,750
Interest Rate
9.1%
Mortgage Type
New Conventional
Create a Home Valuation Report for This Property
The Home Valuation Report is an in-depth analysis detailing your home's value as well as a comparison with similar homes in the area
Home Values in the Area
Average Home Value in this Area
Purchase History
| Date | Buyer | Sale Price | Title Company |
|---|---|---|---|
| Callaway Joshua | $250,000 | -- | |
| Kotter Lisa A | $165,000 | -- | |
| Biscan Dennis C | $155,000 | -- |
Source: Public Records
Mortgage History
| Date | Status | Borrower | Loan Amount |
|---|---|---|---|
| Open | Callaway Joshua | $245,471 | |
| Previous Owner | Kotter Lisa A | $156,750 | |
| Previous Owner | Biscan Dennis C | $160,000 |
Source: Public Records
Tax History Compared to Growth
Tax History
| Year | Tax Paid | Tax Assessment Tax Assessment Total Assessment is a certain percentage of the fair market value that is determined by local assessors to be the total taxable value of land and additions on the property. | Land | Improvement |
|---|---|---|---|---|
| 2025 | $4,576 | $156,120 | $30,000 | $126,120 |
| 2024 | $4,539 | $147,840 | $30,000 | $117,840 |
| 2023 | $4,539 | $148,200 | $35,600 | $112,600 |
| 2022 | $0 | $138,080 | $42,800 | $95,280 |
| 2021 | $3,674 | $105,440 | $22,400 | $83,040 |
| 2020 | $3,698 | $105,440 | $22,400 | $83,040 |
| 2019 | $3,387 | $96,320 | $22,400 | $73,920 |
| 2018 | $3,390 | $96,320 | $22,400 | $73,920 |
| 2016 | $3,211 | $80,840 | $18,000 | $62,840 |
| 2015 | $3,288 | $82,040 | $18,000 | $64,040 |
| 2014 | $3,305 | $82,040 | $18,000 | $64,040 |
Source: Public Records
Map
Nearby Homes
- 4327 Saint Michaels Dr SW
- 1296 Lake Lucerne Rd SW
- 1296 Mandalay Ct SW
- 1093 Hasty Ct SW
- 1102 Timber Glen Ct SW
- 4449 Amberleaf Walk
- 1017 Rolling Forest Ln
- 1178 Carla Joe Dr SW
- 1530 Oleander Ln SW
- 1394 Rustlewood Ct SW
- 1043 Wash Lee Dr SW
- 4665 Redspruce Dr SW
- 4271 Weston Dr SW
- 1337 Arlene Ct SW
- 1276 Hickory Dr SW
- 1246 Tred Avon Way SW
- 1226 Tred Avon Way SW
- 0 Tred Avon Way SW Unit 7485471
- 0 Tred Avon Way SW Unit 7433273
- 0 Tred Avon Way SW Unit 8655435
- 0 Tred Avon Way SW Unit 8129082
- 1247 Tred Avon Way SW
- 1256 Tred Avon Way SW
- 1216 Tred Avon Way SW
- 1257 Aquila Ct
- 4404 5 Forks Rd SW Unit 1
- 1257 Aquila Place SW
- 1267 Tred Avon Way SW
- 1266 Tred Avon Way SW Unit 2
- 4414 5 Forks Rd SW Unit 1
- 4414 Five Forks Trickum Rd SW
- 1267 Aquila Place SW Unit 2
- 1196 Tred Avon Way SW
- 4424 Five Forks Trickum Rd SW
- 4424 5 Forks Rd SW Unit 1