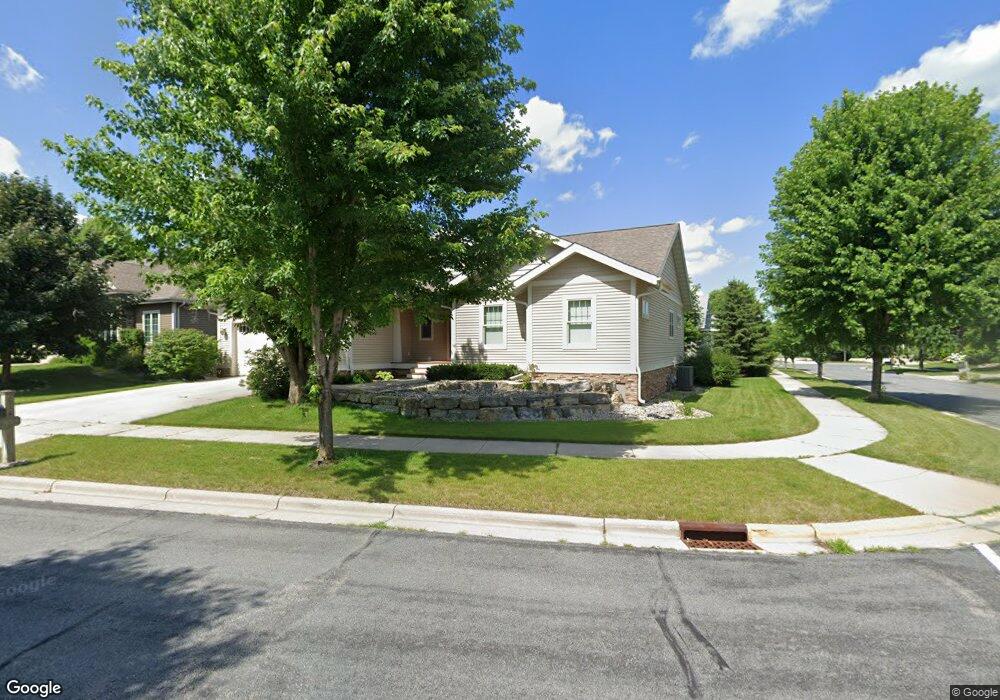
1236 Wenzel Way Waunakee, WI 53597
Estimated Value: $679,091 - $848,000
5
Beds
3
Baths
3,276
Sq Ft
$227/Sq Ft
Est. Value
About This Home
This home is located at 1236 Wenzel Way, Waunakee, WI 53597 and is currently estimated at $744,523, approximately $227 per square foot. 1236 Wenzel Way is a home located in Dane County with nearby schools including Arboretum Elementary School, Waunakee Community Middle School, and Waunakee Intermediate School.
Ownership History
Date
Name
Owned For
Owner Type
Purchase Details
Closed on
Nov 17, 2009
Sold by
Fung Frank B
Bought by
Chowpaknam Nicha N
Current Estimated Value
Home Financials for this Owner
Home Financials are based on the most recent Mortgage that was taken out on this home.
Original Mortgage
$278,000
Outstanding Balance
$182,541
Interest Rate
5.11%
Mortgage Type
New Conventional
Estimated Equity
$561,982
Purchase Details
Closed on
Feb 14, 2006
Sold by
Shively Building Group Llc
Bought by
Fung Frank B and Chowpaknam Nicha N
Home Financials for this Owner
Home Financials are based on the most recent Mortgage that was taken out on this home.
Original Mortgage
$286,000
Interest Rate
6.28%
Mortgage Type
Purchase Money Mortgage
Purchase Details
Closed on
Jul 12, 2005
Sold by
Shively Building Groupllc
Bought by
Shively Building Group Llc
Home Financials for this Owner
Home Financials are based on the most recent Mortgage that was taken out on this home.
Original Mortgage
$94,000
Interest Rate
5.69%
Mortgage Type
Future Advance Clause Open End Mortgage
Create a Home Valuation Report for This Property
The Home Valuation Report is an in-depth analysis detailing your home's value as well as a comparison with similar homes in the area
Home Values in the Area
Average Home Value in this Area
Purchase History
| Date | Buyer | Sale Price | Title Company |
|---|---|---|---|
| Chowpaknam Nicha N | -- | None Available | |
| Fung Frank B | $446,000 | None Available | |
| Shively Building Group Llc | $94,000 | None Available |
Source: Public Records
Mortgage History
| Date | Status | Borrower | Loan Amount |
|---|---|---|---|
| Open | Chowpaknam Nicha N | $278,000 | |
| Previous Owner | Fung Frank B | $286,000 | |
| Previous Owner | Shively Building Group Llc | $94,000 |
Source: Public Records
Tax History Compared to Growth
Tax History
| Year | Tax Paid | Tax Assessment Tax Assessment Total Assessment is a certain percentage of the fair market value that is determined by local assessors to be the total taxable value of land and additions on the property. | Land | Improvement |
|---|---|---|---|---|
| 2024 | $8,583 | $524,100 | $101,500 | $422,600 |
| 2023 | $8,157 | $515,700 | $101,500 | $414,200 |
| 2021 | $8,351 | $427,000 | $95,000 | $332,000 |
| 2020 | $8,088 | $427,000 | $95,000 | $332,000 |
| 2019 | $8,056 | $427,000 | $95,000 | $332,000 |
| 2018 | $7,834 | $367,000 | $92,500 | $274,500 |
| 2017 | $7,778 | $367,000 | $92,500 | $274,500 |
| 2016 | $7,671 | $367,000 | $92,500 | $274,500 |
| 2015 | $7,536 | $367,000 | $92,500 | $274,500 |
| 2014 | -- | $367,000 | $92,500 | $274,500 |
| 2013 | $8,436 | $367,000 | $92,500 | $274,500 |
Source: Public Records
Map
Nearby Homes
- 1306 Hanover Ct
- 1140 Reese Trail
- 1151 Reese Trail
- 5802 Woodland Dr
- 5018 Apricot Blossom Ct
- 5006 Apricot Blossom Ct
- 1109 Stephenson Ln
- 1104 Reese Trail
- 1033 Quinn Dr
- 1110 Stephenson Ln
- 1122 Stephenson Ln
- Lot 36 Cooper Hawk Dr
- Lot 32 Cooper Hawk Dr
- Lot 31 Cooper Hawk St
- Lot 35 Cooper Hawk Dr
- Lot 38 Cooper Hawk Dr
- Lot 29 Cooper Hawk St
- Lot 33 Cooper Hawk Dr
- Lot 34 Cooper Hawk Dr
- 1146 Irene Ct
- 1234 Wenzel Way
- Lot 99 Wenzel Way
- 1235 Hanover Trail
- 1233 Hanover Trail
- 1212 Oneill Passage
- 1232 Wenzel Way
- 1210 Oneill Passage
- 1214 Oneill Passage
- 1231 Hanover Trail
- 1235 Wenzel Way
- 1208 Oneill Passage
- 1233 Wenzel Way
- 1216 Oneill Passage
- 1230 Wenzel Way
- 1229 Hanover Trail
- 1206 Oneill Passage
- 1253 Hanover Trail
- 1231 Wenzel Way
- 1255 Hanover Trail
- 1232 Hanover Trail