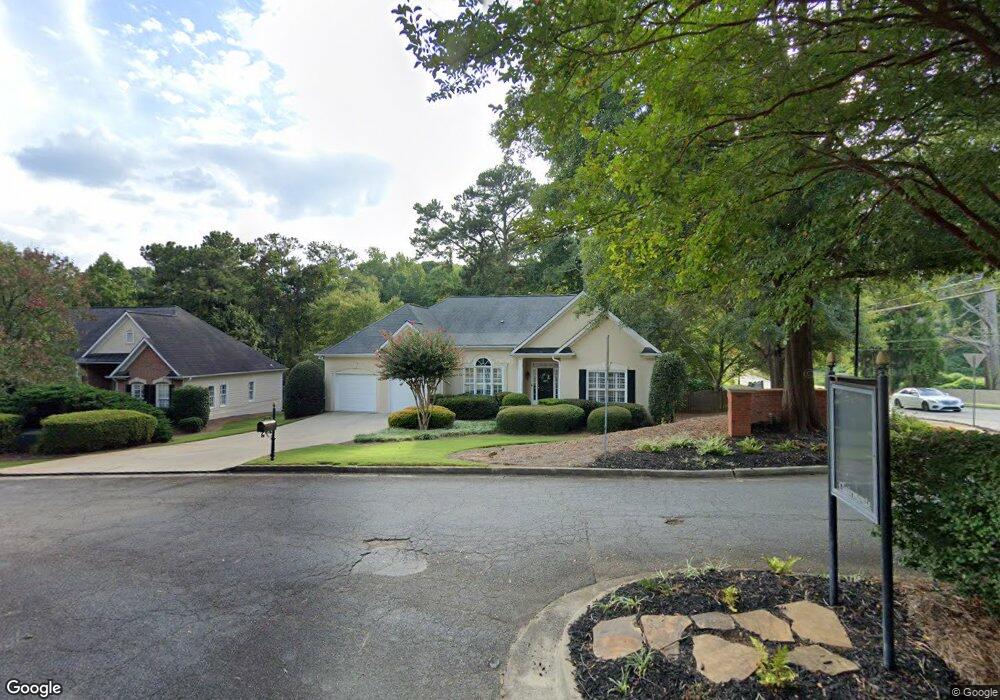
12365 Clairmonte Ave Alpharetta, GA 30009
Estimated Value: $688,911 - $924,000
3
Beds
3
Baths
2,419
Sq Ft
$327/Sq Ft
Est. Value
About This Home
This home is located at 12365 Clairmonte Ave, Alpharetta, GA 30009 and is currently estimated at $791,728, approximately $327 per square foot. 12365 Clairmonte Ave is a home located in Fulton County with nearby schools including Manning Oaks Elementary School, Hopewell Middle School, and Alpharetta High School.
Ownership History
Date
Name
Owned For
Owner Type
Purchase Details
Closed on
Jul 5, 2022
Sold by
Graham Kay C Suc
Bought by
Richardson Trevor and Graham Rebecca
Current Estimated Value
Home Financials for this Owner
Home Financials are based on the most recent Mortgage that was taken out on this home.
Original Mortgage
$332,500
Outstanding Balance
$316,716
Interest Rate
5.23%
Mortgage Type
New Conventional
Estimated Equity
$475,012
Purchase Details
Closed on
Aug 14, 1998
Sold by
Mccar Dev Corp
Bought by
Banks James Hugh
Home Financials for this Owner
Home Financials are based on the most recent Mortgage that was taken out on this home.
Original Mortgage
$150,900
Interest Rate
6.96%
Mortgage Type
New Conventional
Purchase Details
Closed on
Apr 30, 1998
Sold by
Slm Dev Corp
Bought by
Mccar Dev Corp
Home Financials for this Owner
Home Financials are based on the most recent Mortgage that was taken out on this home.
Original Mortgage
$142,800
Interest Rate
7.03%
Mortgage Type
New Conventional
Create a Home Valuation Report for This Property
The Home Valuation Report is an in-depth analysis detailing your home's value as well as a comparison with similar homes in the area
Home Values in the Area
Average Home Value in this Area
Purchase History
| Date | Buyer | Sale Price | Title Company |
|---|---|---|---|
| Richardson Trevor | $475,000 | -- | |
| Banks James Hugh | $188,700 | -- | |
| Mccar Dev Corp | $49,500 | -- |
Source: Public Records
Mortgage History
| Date | Status | Borrower | Loan Amount |
|---|---|---|---|
| Open | Richardson Trevor | $332,500 | |
| Previous Owner | Banks James Hugh | $150,900 | |
| Previous Owner | Mccar Dev Corp | $142,800 |
Source: Public Records
Tax History Compared to Growth
Tax History
| Year | Tax Paid | Tax Assessment Tax Assessment Total Assessment is a certain percentage of the fair market value that is determined by local assessors to be the total taxable value of land and additions on the property. | Land | Improvement |
|---|---|---|---|---|
| 2025 | $993 | $248,680 | $77,520 | $171,160 |
| 2023 | $5,363 | $190,000 | $41,400 | $148,600 |
| 2022 | $2,106 | $199,680 | $38,000 | $161,680 |
| 2021 | $540 | $157,880 | $35,800 | $122,080 |
| 2020 | $2,599 | $143,520 | $39,800 | $103,720 |
| 2019 | $539 | $140,960 | $39,080 | $101,880 |
| 2018 | $2,271 | $137,640 | $38,160 | $99,480 |
| 2017 | $2,030 | $119,480 | $27,600 | $91,880 |
| 2016 | $2,024 | $119,480 | $27,600 | $91,880 |
| 2015 | $4,188 | $119,480 | $27,600 | $91,880 |
| 2014 | $2,347 | $97,600 | $27,320 | $70,280 |
Source: Public Records
Map
Nearby Homes
- 12350 Clairmonte Ave
- 12225 Clairmonte Ave
- 175 Jayne Ellen Way
- 136 Sterling Ct
- 138 Sterling Ct
- 4040 Monroe Ct
- 122 Sterling Ct Unit 122
- 161 Red Oak Ln
- 154 Cold Creek Dr
- 225 Jayne Ellen Way
- 1519 Planters Ridge Ln
- 1085 Pine Grove Dr
- 208 Wade Creek Rd
- Lot 7 Plan at 1858 Downtown
- Lot 9 Plan at 1858 Downtown
- 1630 Homestead Trail
- 2600 Milford Ln
- 221 Academy St
- 2540 Milford Ln
- 12355 Clairmonte Ave
- 3335 East Dr
- 312 Cumming St
- 12345 Clairmonte Ave
- 12360 Clairmonte Ave
- 1015 Clairborne Dr
- 11295 Clairmonte Ave
- 350 Cumming St
- 270 Cumming St
- 100 Jayne Ellen Way
- 281 Cumming St
- 12145 Clairmonte Ave
- 0 Cumming St Unit 8485393
- 0 Cumming St Unit 8001264
- 0 Cumming St Unit 8205014
- 0 Cumming St Unit 8030284
- 0 Cumming St Unit 7597449
- 0 Cumming St Unit 7496322
- 0 Cumming St Unit 8070292