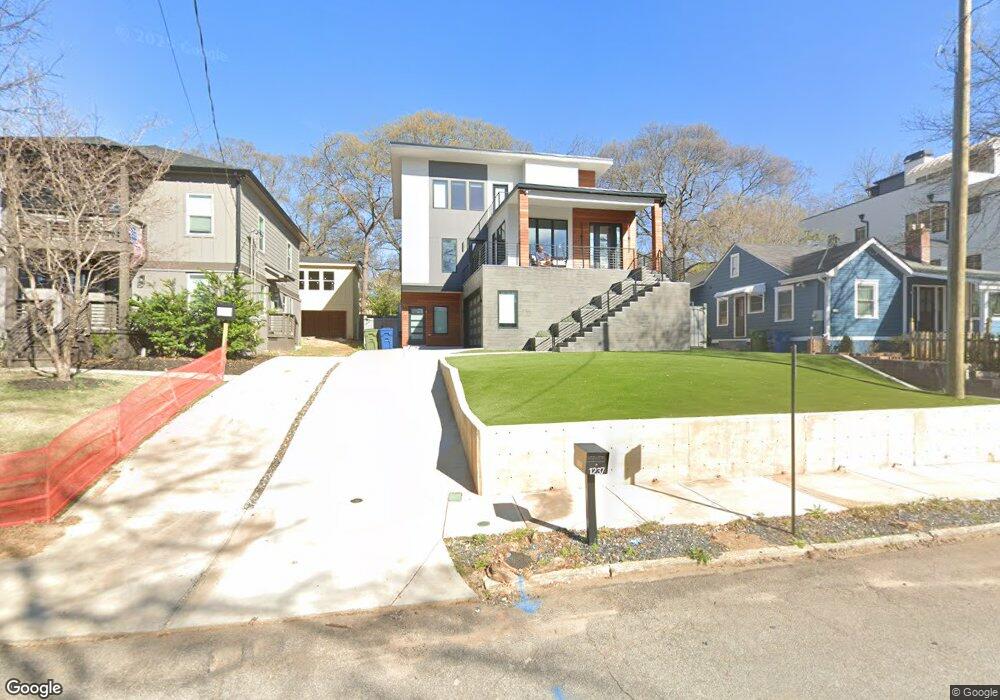
1237 Atlantic Dr NW Unit 13 Atlanta, GA 30318
Home Park NeighborhoodEstimated Value: $1,247,000 - $1,350,910
4
Beds
3
Baths
3,719
Sq Ft
$347/Sq Ft
Est. Value
About This Home
This home is located at 1237 Atlantic Dr NW Unit 13, Atlanta, GA 30318 and is currently estimated at $1,289,970, approximately $346 per square foot. 1237 Atlantic Dr NW Unit 13 is a home located in Fulton County with nearby schools including Midtown High School, Centennial Academy, and Dar Un-Noor School.
Ownership History
Date
Name
Owned For
Owner Type
Purchase Details
Closed on
Mar 6, 2023
Sold by
Simmons Shalynn Haddox
Bought by
Simmons Shalynn Marie and Simmons Kevin Charles
Current Estimated Value
Home Financials for this Owner
Home Financials are based on the most recent Mortgage that was taken out on this home.
Original Mortgage
$150,000
Outstanding Balance
$132,284
Interest Rate
5.14%
Mortgage Type
New Conventional
Estimated Equity
$1,157,686
Purchase Details
Closed on
Mar 18, 2021
Sold by
Garrett Jon Mark
Bought by
Simmons Shalynn Haddox and Simmons Kevin Charles
Home Financials for this Owner
Home Financials are based on the most recent Mortgage that was taken out on this home.
Original Mortgage
$245,000
Interest Rate
2.8%
Mortgage Type
New Conventional
Purchase Details
Closed on
Jun 28, 2011
Sold by
Atlantic Station Biz Llc
Bought by
Garrett Jon M
Purchase Details
Closed on
Mar 2, 2010
Sold by
Atlantic Developers Llc
Bought by
Georgia Bank
Create a Home Valuation Report for This Property
The Home Valuation Report is an in-depth analysis detailing your home's value as well as a comparison with similar homes in the area
Home Values in the Area
Average Home Value in this Area
Purchase History
| Date | Buyer | Sale Price | Title Company |
|---|---|---|---|
| Simmons Shalynn Marie | -- | -- | |
| Simmons Shalynn Haddox | $445,000 | -- | |
| Garrett Jon M | $100,000 | -- | |
| Georgia Bank | $2,830,000 | -- |
Source: Public Records
Mortgage History
| Date | Status | Borrower | Loan Amount |
|---|---|---|---|
| Open | Simmons Shalynn Marie | $150,000 | |
| Previous Owner | Simmons Shalynn Haddox | $245,000 |
Source: Public Records
Tax History Compared to Growth
Tax History
| Year | Tax Paid | Tax Assessment Tax Assessment Total Assessment is a certain percentage of the fair market value that is determined by local assessors to be the total taxable value of land and additions on the property. | Land | Improvement |
|---|---|---|---|---|
| 2025 | $11,485 | $684,920 | $68,840 | $616,080 |
| 2023 | $16,606 | $401,120 | $59,480 | $341,640 |
| 2022 | $2,407 | $59,480 | $59,480 | $0 |
| 2021 | $2,051 | $50,640 | $50,640 | $0 |
| 2020 | $1,765 | $43,080 | $43,080 | $0 |
| 2019 | $421 | $42,320 | $42,320 | $0 |
| 2018 | $747 | $18,040 | $18,040 | $0 |
| 2017 | $530 | $12,280 | $12,280 | $0 |
| 2016 | $532 | $12,280 | $12,280 | $0 |
| 2015 | $533 | $12,280 | $12,280 | $0 |
| 2014 | $557 | $12,280 | $12,280 | $0 |
Source: Public Records
Map
Nearby Homes
- 1186 Francis St NW
- 383 16th St NW Unit 3
- 385 15th St NW Unit 6
- 384 16th St NW Unit 1
- 1205 Holly St NW Unit B
- 1205 Holly St NW Unit A
- 395 Laurent St NW Unit 4
- 1267 Lyle Place NW
- 270 17th St NW Unit 1407
- 270 17th St NW Unit 2207
- 270 17th St NW Unit 813
- 270 17th St NW Unit 2210
- 270 17th St NW
- 270 17th St NW Unit 2501
- 270 17th St NW Unit 3510
- 270 17th St NW Unit 3606
- 270 17th St NW Unit 2012
- 270 17th St NW Unit 1413
- 1237 Atlantic Dr NW
- 1241 Atlantic Dr NW
- 1233 Atlantic Dr NW
- 1227 Atlantic Dr NW
- 15th 15th St NW Unit 3
- 15th 15th St NW Unit 4
- 15th 15th St NW Unit 2
- 15th 15th St NW Unit 6
- 15th 15th St NW Unit 74
- 15th 15th St NW Unit 1
- 15th 15th St NW
- 15th 15th St NW
- 1247 Atlantic Dr NW
- 1238 Francis St NW
- 1248 Francis St NW
- 1234 Francis St NW
- 1253 Atlantic Dr NW
- 1250 Francis St NW
- 1228 Francis St NW
- 1219 Atlantic Dr NW