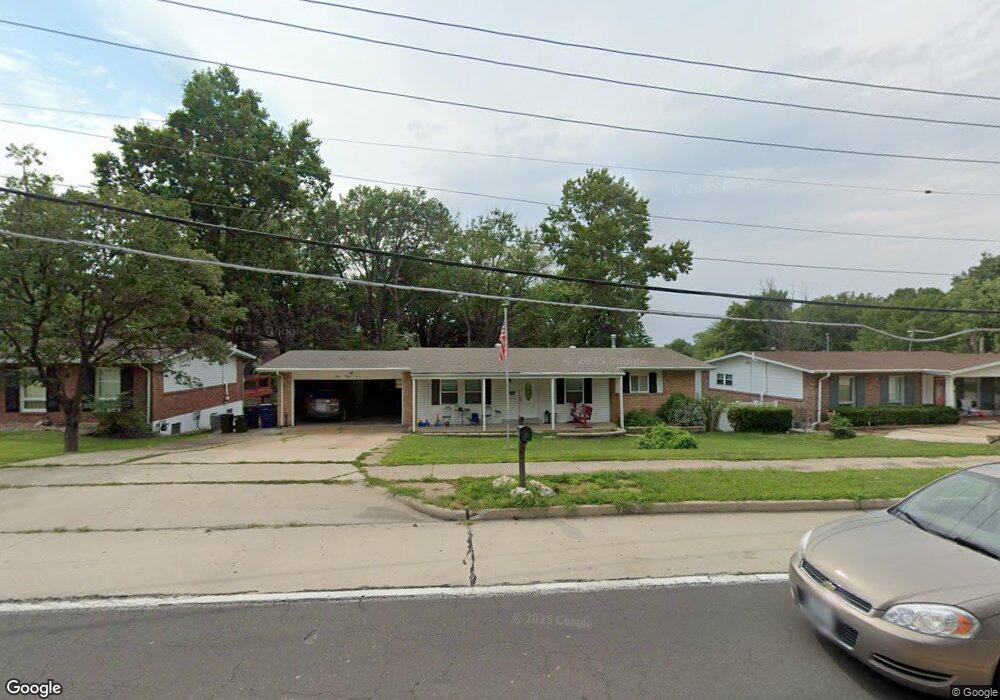
1237 Craig Rd Saint Louis, MO 63146
Estimated Value: $279,000 - $326,000
3
Beds
2
Baths
1,408
Sq Ft
$220/Sq Ft
Est. Value
About This Home
This home is located at 1237 Craig Rd, Saint Louis, MO 63146 and is currently estimated at $310,411, approximately $220 per square foot. 1237 Craig Rd is a home located in St. Louis County with nearby schools including Craig Elementary School, Parkway Northeast Middle School, and Parkway North High School.
Ownership History
Date
Name
Owned For
Owner Type
Purchase Details
Closed on
Jan 2, 2019
Sold by
Saller Eric and Saller Eric D
Bought by
Saller Eric D and Saller Stephanie A
Current Estimated Value
Home Financials for this Owner
Home Financials are based on the most recent Mortgage that was taken out on this home.
Original Mortgage
$22,700
Outstanding Balance
$14,577
Interest Rate
4.8%
Mortgage Type
Commercial
Estimated Equity
$295,834
Purchase Details
Closed on
Apr 25, 2014
Sold by
Levy Debra
Bought by
Saller Eric
Home Financials for this Owner
Home Financials are based on the most recent Mortgage that was taken out on this home.
Original Mortgage
$143,560
Outstanding Balance
$109,215
Interest Rate
4.36%
Mortgage Type
New Conventional
Estimated Equity
$201,196
Purchase Details
Closed on
Aug 25, 2010
Sold by
Knight Organization Inc
Bought by
Levy Deborah A
Purchase Details
Closed on
Jul 22, 2010
Sold by
Willenberger Lars
Bought by
Knight Organization Inc
Purchase Details
Closed on
May 20, 2002
Sold by
Willenberger Lars
Bought by
Willenberger Lars
Create a Home Valuation Report for This Property
The Home Valuation Report is an in-depth analysis detailing your home's value as well as a comparison with similar homes in the area
Home Values in the Area
Average Home Value in this Area
Purchase History
| Date | Buyer | Sale Price | Title Company |
|---|---|---|---|
| Saller Eric D | -- | Netco | |
| Saller Eric | $148,000 | Resolutions Title Inc | |
| Levy Deborah A | $114,500 | Tri | |
| Knight Organization Inc | $86,136 | Title Resources Inc | |
| Willenberger Lars | $119,120 | -- |
Source: Public Records
Mortgage History
| Date | Status | Borrower | Loan Amount |
|---|---|---|---|
| Open | Saller Eric D | $22,700 | |
| Open | Saller Eric | $143,560 |
Source: Public Records
Tax History Compared to Growth
Tax History
| Year | Tax Paid | Tax Assessment Tax Assessment Total Assessment is a certain percentage of the fair market value that is determined by local assessors to be the total taxable value of land and additions on the property. | Land | Improvement |
|---|---|---|---|---|
| 2025 | $3,250 | $53,900 | $34,180 | $19,720 |
| 2024 | $3,250 | $49,590 | $23,940 | $25,650 |
| 2023 | $3,208 | $49,590 | $23,940 | $25,650 |
| 2022 | $2,667 | $37,520 | $20,500 | $17,020 |
| 2021 | $2,648 | $37,520 | $20,500 | $17,020 |
| 2020 | $2,418 | $32,690 | $22,140 | $10,550 |
| 2019 | $2,380 | $32,690 | $22,140 | $10,550 |
| 2018 | $2,450 | $31,080 | $17,080 | $14,000 |
| 2017 | $2,432 | $31,080 | $17,080 | $14,000 |
| 2016 | $2,415 | $29,350 | $11,950 | $17,400 |
| 2015 | $2,518 | $29,350 | $11,950 | $17,400 |
| 2014 | $2,726 | $34,000 | $9,410 | $24,590 |
Source: Public Records
Map
Nearby Homes
- 1267 Craig Rd
- 11993 Moorland Manor Ct
- 1425 Craig Rd
- 842 N New Ballas Ct Unit 302
- 11220 Trieste Dr
- 12045 Bridal Shire Ct
- 950 E Rue de La Banque Unit 202
- 950 E Rue de La Banque Unit 317
- 950 E Rue de La Banque Unit 118
- 950 E Rue de La Banque Unit L1
- 11861 Spruce Orchard Dr
- 1407 Summerhaven Dr
- 11655 Holly Springs Dr
- 648 Coeur de Royale Dr Unit B
- 11875 Gold Leaf Dr
- 630 Emerson Rd Unit 206
- 585 Coeur de Royale Dr Unit 405
- 585 Coeur de Royale Dr Unit 201
- 585 Coeur de Royale Dr Unit 206
- 11017 Sandistan Dr
- 1231 Craig Rd
- 1243 Craig Rd
- 1230 Bonheur Dr
- 1236 Bonheur Dr
- 1225 Craig Rd
- 1251 Craig Rd
- 1224 Bonheur Dr
- 11498 Daykin Dr
- 1242 Bonheur Dr
- 1219 Craig Rd
- 1259 Craig Rd
- 1238 Craig Rd
- 1224 Craig Rd
- 11499 Daykin Dr
- 1218 Bonheur Dr
- 11494 Daykin Dr
- 1248 Bonheur Dr
- 11921 Moorland Woods Cir
- 1211 Craig Rd
- 1210 Bonheur Dr