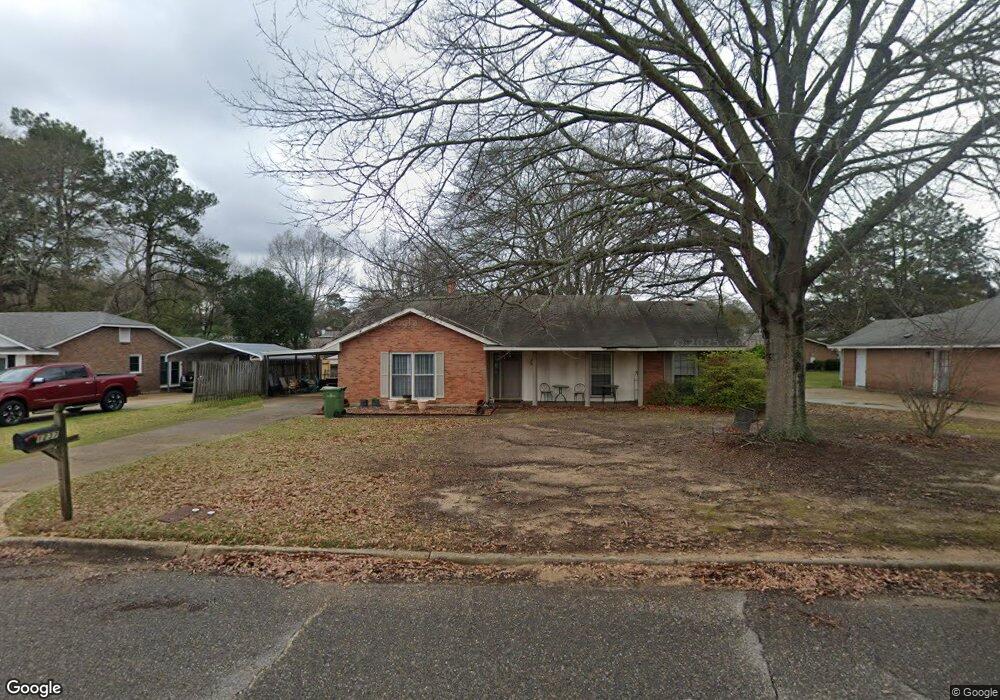
1237 Lyman Ct Montgomery, AL 36109
East Montgomery NeighborhoodEstimated Value: $170,000 - $199,000
3
Beds
2
Baths
1,770
Sq Ft
$103/Sq Ft
Est. Value
About This Home
This home is located at 1237 Lyman Ct, Montgomery, AL 36109 and is currently estimated at $182,094, approximately $102 per square foot. 1237 Lyman Ct is a home located in Montgomery County with nearby schools including Dalraida Elementary School, Goodwyn Middle School, and Dr. Percy L. Julian High School.
Ownership History
Date
Name
Owned For
Owner Type
Purchase Details
Closed on
Jan 8, 2003
Sold by
Mortgage Guaranty Insurance Corp
Bought by
Schofield Jimmy W and Schofield Tina J
Current Estimated Value
Home Financials for this Owner
Home Financials are based on the most recent Mortgage that was taken out on this home.
Original Mortgage
$90,174
Outstanding Balance
$38,693
Interest Rate
6.1%
Mortgage Type
FHA
Estimated Equity
$143,401
Purchase Details
Closed on
Nov 18, 2002
Sold by
Federal Home Loan Mortgage Corporation
Bought by
Mortgage Guaranty Insurance Corp
Home Financials for this Owner
Home Financials are based on the most recent Mortgage that was taken out on this home.
Original Mortgage
$90,174
Outstanding Balance
$38,693
Interest Rate
6.1%
Mortgage Type
FHA
Estimated Equity
$143,401
Purchase Details
Closed on
Mar 22, 2002
Sold by
Burks Carrie
Bought by
Wells Fargo Home Mtg Inc
Create a Home Valuation Report for This Property
The Home Valuation Report is an in-depth analysis detailing your home's value as well as a comparison with similar homes in the area
Home Values in the Area
Average Home Value in this Area
Purchase History
| Date | Buyer | Sale Price | Title Company |
|---|---|---|---|
| Schofield Jimmy W | $91,674 | -- | |
| Mortgage Guaranty Insurance Corp | -- | -- | |
| Wells Fargo Home Mtg Inc | $90,116 | -- | |
| Wells Fargo Home Mtg Inc | $90,116 | -- |
Source: Public Records
Mortgage History
| Date | Status | Borrower | Loan Amount |
|---|---|---|---|
| Open | Schofield Jimmy W | $90,174 |
Source: Public Records
Tax History
| Year | Tax Paid | Tax Assessment Tax Assessment Total Assessment is a certain percentage of the fair market value that is determined by local assessors to be the total taxable value of land and additions on the property. | Land | Improvement |
|---|---|---|---|---|
| 2025 | $780 | $16,720 | $2,500 | $14,220 |
| 2024 | $834 | $17,840 | $2,500 | $15,340 |
| 2023 | $834 | $13,920 | $2,500 | $11,420 |
| 2022 | $431 | $12,930 | $2,500 | $10,430 |
| 2021 | $466 | $13,880 | $0 | $0 |
| 2020 | $423 | $12,700 | $2,500 | $10,200 |
| 2019 | $358 | $10,930 | $2,500 | $8,430 |
| 2018 | $450 | $12,330 | $2,500 | $9,830 |
| 2017 | $432 | $25,900 | $5,000 | $20,900 |
| 2014 | $404 | $12,180 | $2,500 | $9,680 |
| 2013 | -- | $11,520 | $2,500 | $9,020 |
Source: Public Records
Map
Nearby Homes
- 3890 Beardsley Dr
- 1221 Dalraida Rd
- 1237 Edgeworth Dr
- 3719 Cricklewood Dr
- 1218 Hillman St
- 932 Green Forest Dr
- 3735 Dalraida Terrace
- 925 Green Forest Dr
- 1547 Pine Ridge Rd
- 1312 Hillman St
- 3716 Dalraida Terrace
- 3706 Princess Ann St
- 3757 Marie Cook Dr
- 3807 Marie Cook Dr
- 3813 Marie Cook Dr
- 3556 Prince George Dr
- 913 Hillman St
- 3913 Elm Ave
- 1348 Hillman St
- 3764 Marie Cook Dr
- 1231 Lyman Ct
- 1243 Lyman Ct
- 3850 Beardsley Dr
- 1225 Lyman Ct
- 1230 Cedric Ct
- 1230 Lyman Ct
- 3880 Beardsley Dr
- 1224 Cedric Ct
- 1240 Cedric Ct
- 1224 Lyman Ct
- 1219 Lyman Ct
- 1218 Lyman Ct
- 1218 Cedric Ct
- 3861 Beardsley Dr
- 3871 Beardsley Dr
- 3851 Beardsley Dr
- 3881 Beardsley Dr
- 1212 Lyman Ct
- 1212 Cedric Ct
- 3841 Beardsley Dr
Your Personal Tour Guide
Ask me questions while you tour the home.