Estimated Value: $439,679 - $541,000
Studio
--
Bath
1,645
Sq Ft
$302/Sq Ft
Est. Value
About This Home
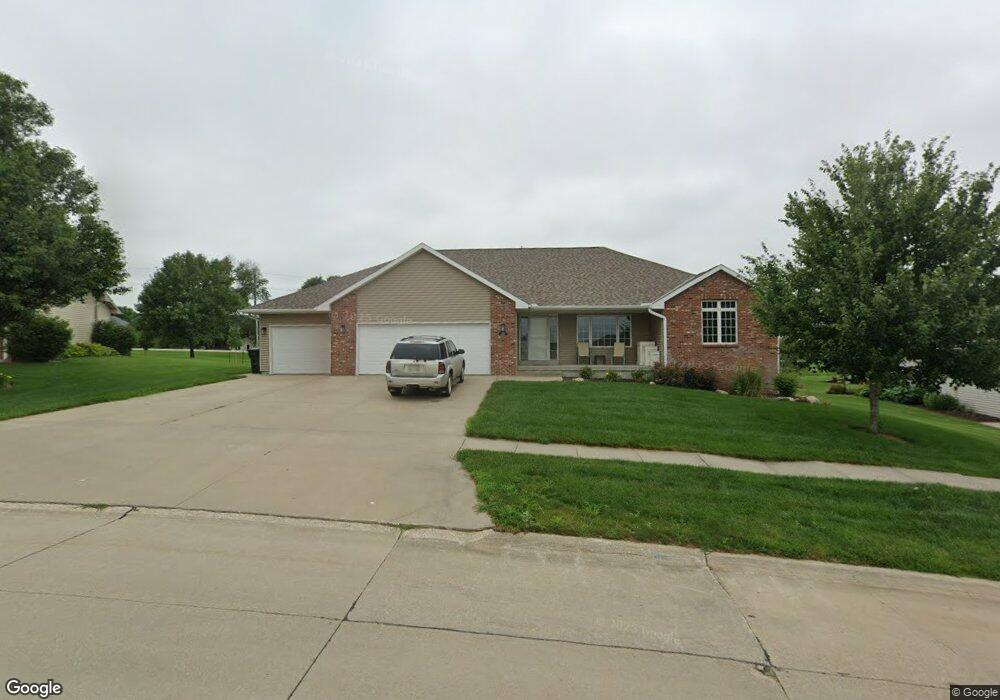
This home is located at 1237 Maly Blvd, Wahoo, NE 68066 and is currently estimated at $496,670, approximately $301 per square foot. 1237 Maly Blvd is a home located in Saunders County with nearby schools including Wahoo Elementary School, Wahoo Middle School, and Wahoo High School.
Ownership History
Date
Name
Owned For
Owner Type
Purchase Details
Closed on
Oct 24, 2017
Sold by
Obert Rhonda A
Bought by
Obert Eric C
Current Estimated Value
Purchase Details
Closed on
May 26, 2016
Sold by
Libal Jason and Libal Michelle
Bought by
Obert Eric C
Home Financials for this Owner
Home Financials are based on the most recent Mortgage that was taken out on this home.
Original Mortgage
$208,000
Outstanding Balance
$164,412
Interest Rate
3.61%
Mortgage Type
New Conventional
Estimated Equity
$332,258
Purchase Details
Closed on
Sep 15, 2009
Sold by
Wahoo Built Homes Llc
Bought by
Libal Jason and Libal Michelle
Home Financials for this Owner
Home Financials are based on the most recent Mortgage that was taken out on this home.
Original Mortgage
$170,725
Interest Rate
5.2%
Create a Home Valuation Report for This Property
The Home Valuation Report is an in-depth analysis detailing your home's value as well as a comparison with similar homes in the area
Home Values in the Area
Average Home Value in this Area
Purchase History
| Date | Buyer | Sale Price | Title Company |
|---|---|---|---|
| Obert Eric C | -- | None Available | |
| Obert Eric C | $260,000 | None Available | |
| Libal Jason | -- | -- |
Source: Public Records
Mortgage History
| Date | Status | Borrower | Loan Amount |
|---|---|---|---|
| Open | Obert Eric C | $208,000 | |
| Previous Owner | Libal Jason | $0 | |
| Previous Owner | Libal Jason | $0 | |
| Previous Owner | Libal Jason | $170,725 |
Source: Public Records
Tax History
| Year | Tax Paid | Tax Assessment Tax Assessment Total Assessment is a certain percentage of the fair market value that is determined by local assessors to be the total taxable value of land and additions on the property. | Land | Improvement |
|---|---|---|---|---|
| 2025 | $5,860 | $434,646 | $40,000 | $394,646 |
| 2024 | $5,073 | $375,039 | $32,000 | $343,039 |
| 2023 | $6,365 | $363,675 | $32,000 | $331,675 |
| 2022 | $5,791 | $308,749 | $32,000 | $276,749 |
| 2021 | $5,646 | $292,862 | $32,000 | $260,862 |
| 2020 | $5,490 | $282,924 | $32,000 | $250,924 |
| 2019 | $5,542 | $279,198 | $32,000 | $247,198 |
| 2018 | $5,044 | $243,350 | $30,000 | $213,350 |
| 2017 | $5,028 | $243,350 | $30,000 | $213,350 |
| 2016 | $5,103 | $243,350 | $30,000 | $213,350 |
| 2015 | $5,140 | $243,350 | $30,000 | $213,350 |
| 2014 | $5,231 | $243,350 | $30,000 | $213,350 |
| 2012 | $5,075 | $223,080 | $30,000 | $193,080 |
Source: Public Records
Map
Nearby Homes
- 26.26 Acres NW 19th & County Road Q
- Lot 3 Wanahoo Ridges
- 243 S Linden St
- 453 W 4th St
- 1210 Woodland Rd
- 453 W 7th St
- 565 W 10th St
- 468 E 10th St
- 720 W 10th St
- 1152 N Sycamore St
- 1246 N Broadway St
- 1175 N Locust St
- 2125 N Broadway St
- 478 E 15th St
- 1502 Spruce St
- 1989 N Linden St
- 731 W 24th Cir
- 778 W 24th Cir
- 1644 County Road 16
- 0 County Road 13
- 1217 Maly Blvd
- 1247 Maly Blvd
- 0 Lot 6 Maly Blvd Unit 10068483
- 0 Lot 13 Maly Blvd Unit 10068500
- 0 Lot 13 Maly Blvd Unit 10094491
- 0 Lot 7 Maly Blvd Unit 10094481
- 0 Lot 6 Maly Blvd Unit 10094479
- 0 Lot 13 Maly Blvd Unit L10048292
- 0 Lot 6 Maly Blvd Unit L10048278
- 0 Lot 7 Maly Blvd Unit L10068484
- 0 Lot 7 Maly Blvd Unit L10048279
- 1259 Maly Blvd
- 1191 Maly Blvd
- 1216 Maly Blvd
- 301 W Sloup Dr
- 1254 Maly Blvd
- 1275 Maly Blvd
- 1196 Maly Blvd
- 295 W Sloup Dr
- 29 Club Cir
Your Personal Tour Guide
Ask me questions while you tour the home.