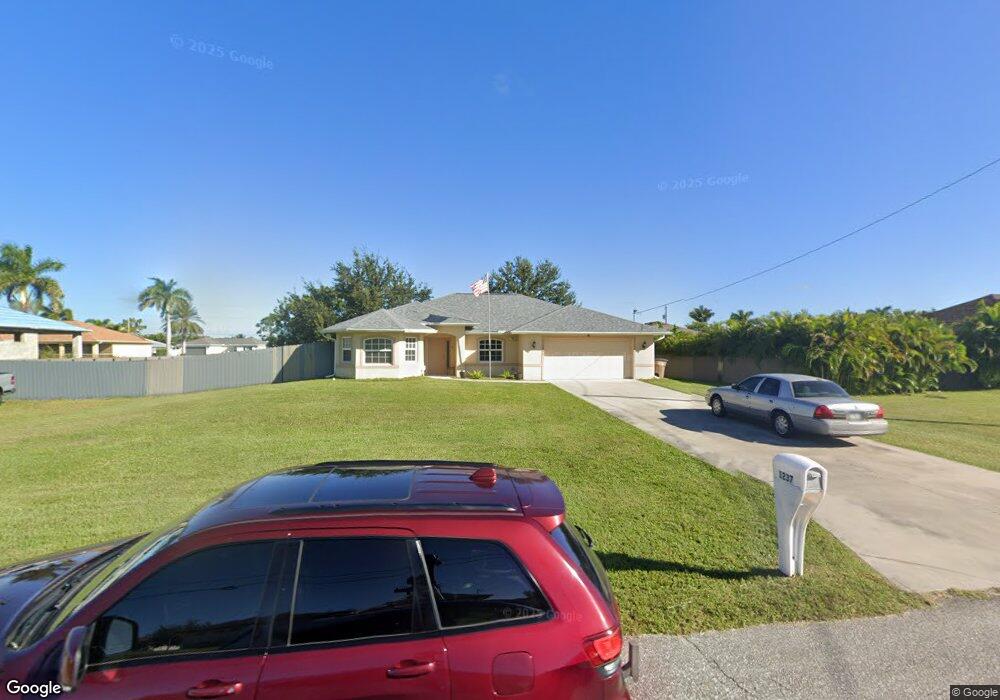
1237 NW 18th Terrace Cape Coral, FL 33993
Mariner NeighborhoodEstimated Value: $294,000 - $369,000
3
Beds
2
Baths
1,823
Sq Ft
$177/Sq Ft
Est. Value
About This Home
This home is located at 1237 NW 18th Terrace, Cape Coral, FL 33993 and is currently estimated at $322,130, approximately $176 per square foot. 1237 NW 18th Terrace is a home located in Lee County with nearby schools including Dr. Carrie D. Robinson Littleton Elementary School, Caloosa Elementary School, and Tropic Isles Elementary School.
Ownership History
Date
Name
Owned For
Owner Type
Purchase Details
Closed on
Jun 23, 2021
Sold by
Kelley Edward C and Kelley Lim S
Bought by
Kelley Edward C and Kelley Jennifer M
Current Estimated Value
Home Financials for this Owner
Home Financials are based on the most recent Mortgage that was taken out on this home.
Original Mortgage
$180,000
Outstanding Balance
$162,968
Interest Rate
2.9%
Mortgage Type
New Conventional
Estimated Equity
$159,162
Purchase Details
Closed on
Mar 9, 2012
Sold by
Fifth Third Bank Na
Bought by
Kelley Edward C and Kelley Lin S
Purchase Details
Closed on
Jan 31, 2012
Sold by
Ferrari Pasquale
Bought by
Fifth Third Bank Na
Purchase Details
Closed on
Oct 5, 2004
Sold by
Thomas David Blake
Bought by
Ferrari Pasquale and The Pasquale Ferrari Family Trust
Purchase Details
Closed on
Dec 24, 2002
Sold by
Dev & Land Inc
Bought by
Thomas David Blake
Purchase Details
Closed on
Oct 1, 2001
Sold by
Brace Dwight and Brace Richard
Bought by
Dev Land Inc
Create a Home Valuation Report for This Property
The Home Valuation Report is an in-depth analysis detailing your home's value as well as a comparison with similar homes in the area
Home Values in the Area
Average Home Value in this Area
Purchase History
| Date | Buyer | Sale Price | Title Company |
|---|---|---|---|
| Kelley Edward C | $225,000 | Accommodation | |
| Kelley Edward C | $109,900 | Clear Title America | |
| Fifth Third Bank Na | $2,300 | None Available | |
| Ferrari Pasquale | $50,000 | First American Title Ins Co | |
| Thomas David Blake | $3,500 | -- | |
| Dev Land Inc | $1,200 | -- |
Source: Public Records
Mortgage History
| Date | Status | Borrower | Loan Amount |
|---|---|---|---|
| Open | Kelley Edward C | $180,000 |
Source: Public Records
Tax History Compared to Growth
Tax History
| Year | Tax Paid | Tax Assessment Tax Assessment Total Assessment is a certain percentage of the fair market value that is determined by local assessors to be the total taxable value of land and additions on the property. | Land | Improvement |
|---|---|---|---|---|
| 2025 | $4,514 | $262,439 | $44,090 | $206,977 |
| 2024 | $4,414 | $268,914 | $46,580 | $222,334 |
| 2023 | $4,414 | $263,733 | $31,060 | $232,673 |
| 2022 | $4,356 | $269,263 | $20,800 | $248,463 |
| 2021 | $3,830 | $183,219 | $10,400 | $172,819 |
| 2020 | $3,692 | $169,591 | $9,400 | $160,191 |
| 2019 | $3,576 | $164,732 | $11,000 | $153,732 |
| 2018 | $3,531 | $165,535 | $11,000 | $154,535 |
| 2017 | $3,375 | $159,873 | $7,700 | $152,173 |
| 2016 | $3,074 | $140,633 | $7,700 | $132,933 |
| 2015 | $2,842 | $123,397 | $7,100 | $116,297 |
| 2014 | $2,654 | $115,692 | $6,100 | $109,592 |
| 2013 | -- | $96,791 | $5,200 | $91,591 |
Source: Public Records
Map
Nearby Homes
- 1246 NW 19th St
- 1226 NW 19th Terrace
- 1242 NW 18th St
- 1206 NW 18th Terrace
- 1202 NW 18th Terrace
- 1415 NW 18th Terrace
- 1904 NW 11th Ct
- 1422 NW 19th Terrace
- 1701 NW 14th Ave
- 1114 NW 19th St
- 1506 NW 19th St
- 1105 NW 18th Terrace
- 1733 NW 11th Place
- 1415 NW 17th St
- 1206 NW 16th Terrace
- 1107 NW 19th Terrace
- 1027 NW 19th St
- 1423 NW 20th Terrace
- 1746 NW 17th St
- 2059 NW 17th St
- 1241 NW 18th Terrace
- 1234 NW 19th St
- 1231 NW 18th Terrace
- 1230 NW 19th St
- 1242 NW 19th St
- 1236 NW 18th Terrace
- 1232 NW 18th Terrace
- 1247 NW 18th Terrace
- 1225 NW 18th Terrace
- 1226 NW 19th St
- 1244 NW 18th Terrace
- 1221 NW 18th Terrace
- 1224 NW 18th Terrace
- 1235 NW 19th St
- 1239 NW 19th St
- 1233 NW 18th St
- 1237 NW 18th St
- 1220 NW 19th St
- 1300 NW 18th Terrace
- 1229 NW 19th St