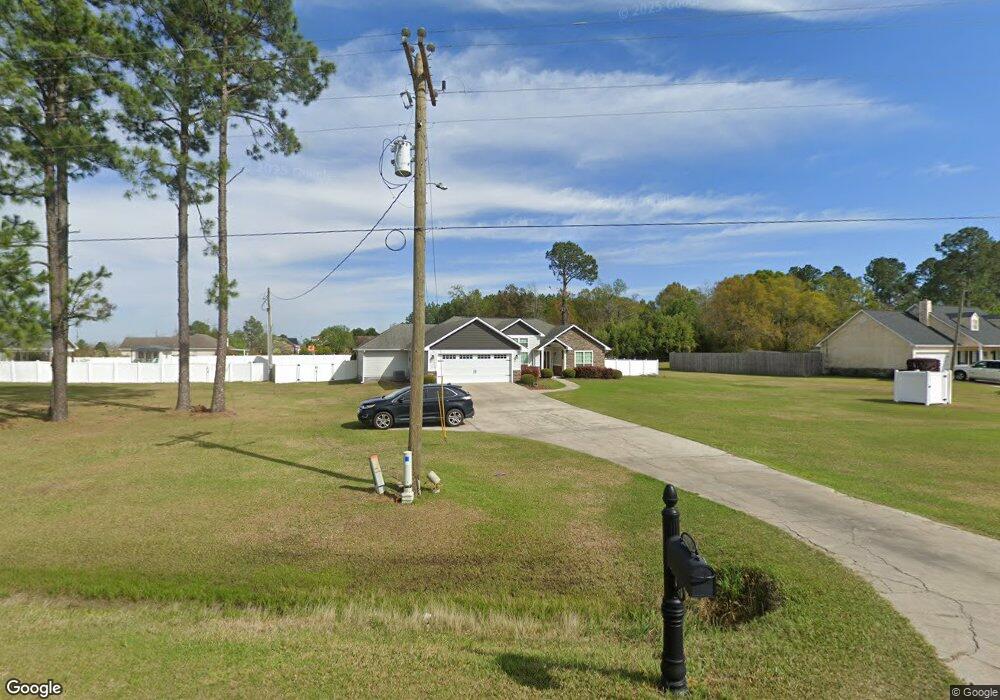
1237 Vo Tech Dr Fitzgerald, GA 31750
Estimated Value: $202,633 - $248,000
3
Beds
3
Baths
1,966
Sq Ft
$119/Sq Ft
Est. Value
About This Home
This home is located at 1237 Vo Tech Dr, Fitzgerald, GA 31750 and is currently estimated at $233,408, approximately $118 per square foot. 1237 Vo Tech Dr is a home located in Irwin County with nearby schools including Irwin County Elementary School, Irwin County Middle School, and Irwin County High School.
Ownership History
Date
Name
Owned For
Owner Type
Purchase Details
Closed on
Mar 19, 2008
Sold by
Security Bank & Trust Co O
Bought by
Albany Realty Co
Current Estimated Value
Purchase Details
Closed on
Dec 12, 2007
Sold by
Branch Joshua R
Bought by
Fields Heather M and Fields John S
Home Financials for this Owner
Home Financials are based on the most recent Mortgage that was taken out on this home.
Original Mortgage
$130,200
Interest Rate
6.21%
Mortgage Type
New Conventional
Purchase Details
Closed on
May 26, 2005
Sold by
Whittle Lynn W
Bought by
Branch Joshua R
Home Financials for this Owner
Home Financials are based on the most recent Mortgage that was taken out on this home.
Original Mortgage
$123,500
Interest Rate
5.69%
Mortgage Type
New Conventional
Purchase Details
Closed on
Jun 15, 2001
Sold by
Pittman George C
Bought by
Whittle Lynn W
Purchase Details
Closed on
Jun 2, 1997
Sold by
Peacock Construction
Bought by
Pittman George C
Create a Home Valuation Report for This Property
The Home Valuation Report is an in-depth analysis detailing your home's value as well as a comparison with similar homes in the area
Home Values in the Area
Average Home Value in this Area
Purchase History
| Date | Buyer | Sale Price | Title Company |
|---|---|---|---|
| Albany Realty Co | -- | -- | |
| Fields Heather M | $126,500 | -- | |
| Branch Joshua R | $130,000 | -- | |
| Whittle Lynn W | $103,000 | -- | |
| Pittman George C | $93,000 | -- |
Source: Public Records
Mortgage History
| Date | Status | Borrower | Loan Amount |
|---|---|---|---|
| Previous Owner | Fields Heather M | $130,200 | |
| Previous Owner | Branch Joshua R | $123,500 |
Source: Public Records
Tax History Compared to Growth
Tax History
| Year | Tax Paid | Tax Assessment Tax Assessment Total Assessment is a certain percentage of the fair market value that is determined by local assessors to be the total taxable value of land and additions on the property. | Land | Improvement |
|---|---|---|---|---|
| 2024 | $1,251 | $41,720 | $4,000 | $37,720 |
| 2023 | $1,251 | $41,720 | $4,000 | $37,720 |
| 2022 | $1,251 | $41,720 | $4,000 | $37,720 |
| 2021 | $1,251 | $41,720 | $4,000 | $37,720 |
| 2020 | $1,251 | $41,720 | $4,000 | $37,720 |
| 2019 | $1,711 | $56,321 | $4,000 | $52,321 |
| 2018 | $1,618 | $56,321 | $4,000 | $52,321 |
| 2017 | $1,456 | $50,687 | $4,000 | $46,687 |
| 2016 | $1,413 | $50,687 | $4,000 | $46,687 |
| 2015 | -- | $50,687 | $4,000 | $46,687 |
| 2014 | -- | $50,687 | $4,000 | $46,687 |
| 2013 | -- | $50,686 | $4,000 | $46,686 |
Source: Public Records
Map
Nearby Homes
- 1236 Vo Tech Dr
- 0 Ineva Cir Unit 7 10610088
- 0 Ineva Cir
- 118 Bulldog Dr
- 213 Sly Hill Rd
- 107 Riverview Loop
- 144 Frank Church Rd
- 110 Lakewood Dr
- 212 Frank Rd
- 221 Gettysburg Rd
- 985 Frank Rd
- 0 Sparrow Rd
- 709 W 4th St
- 200 Greenbrier Cir
- 243 Perry House Rd
- 0 Benjamin H Hill Dr Unit 21545626
- 440 Ocilla Hwy
- 201 S Irwin Ave
- 301 S Beech St
- 309 S Alder St
- 1237 Vo Tech Rd
- 390 Old Whitley Crossing
- 1227 Vo Tech Dr
- 382 Old Whitley Crossing
- 1225 Vo Tech Dr
- 1240 Vo Tech Dr
- 1240 Vo Tech Rd
- 1207 Vo Tech Dr
- 1236 Vo Tech Rd
- 1221 Vo Tech Dr
- 1230 Vo Tech Dr
- 1224 Ineva Cir
- 376 Old Whitley Crossing
- 1244 Ineva Cir
- 1230 Vo Tech Rd
- 1246 Ineva Cir
- 1226 Vo Tech Dr
- 1262 Vo Tech Dr
- 1248 Ineva Cir
- 1241 Ineva Cir