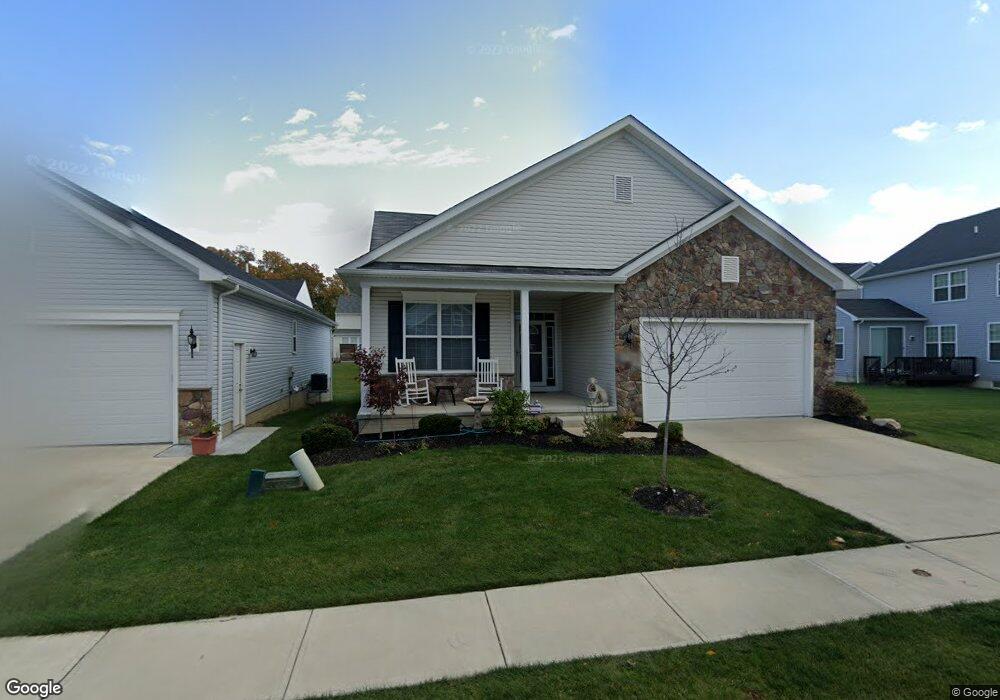
12375 Edgebrook Dr Strongsville, OH 44149
Estimated Value: $389,000 - $485,000
2
Beds
2
Baths
1,940
Sq Ft
$226/Sq Ft
Est. Value
About This Home
This home is located at 12375 Edgebrook Dr, Strongsville, OH 44149 and is currently estimated at $438,425, approximately $225 per square foot. 12375 Edgebrook Dr is a home with nearby schools including Strongsville High School, Strongsville Academy, and Sts Joseph & John Interparochial School.
Ownership History
Date
Name
Owned For
Owner Type
Purchase Details
Closed on
Feb 23, 2024
Sold by
Stickler Danielle E and Parks Sharon D
Bought by
Parks Sharon D and Stickler Danielle R
Current Estimated Value
Home Financials for this Owner
Home Financials are based on the most recent Mortgage that was taken out on this home.
Original Mortgage
$329,670
Outstanding Balance
$323,440
Interest Rate
6.25%
Mortgage Type
FHA
Estimated Equity
$114,985
Purchase Details
Closed on
Jul 20, 2017
Sold by
K Hovnanian Edgebrook Llc
Bought by
Parks Sharon D and Stickler Danielle E
Home Financials for this Owner
Home Financials are based on the most recent Mortgage that was taken out on this home.
Original Mortgage
$249,990
Interest Rate
3.9%
Mortgage Type
New Conventional
Purchase Details
Closed on
Oct 7, 2015
Sold by
Edgebrook Llc
Bought by
K Hovnanian Edgebrook Llc
Create a Home Valuation Report for This Property
The Home Valuation Report is an in-depth analysis detailing your home's value as well as a comparison with similar homes in the area
Home Values in the Area
Average Home Value in this Area
Purchase History
| Date | Buyer | Sale Price | Title Company |
|---|---|---|---|
| Parks Sharon D | -- | None Listed On Document | |
| Parks Sharon D | $312,488 | Millennium Title Agency | |
| K Hovnanian Edgebrook Llc | $236,000 | Chicago Title Insurance Co |
Source: Public Records
Mortgage History
| Date | Status | Borrower | Loan Amount |
|---|---|---|---|
| Open | Parks Sharon D | $329,670 | |
| Previous Owner | Parks Sharon D | $249,990 |
Source: Public Records
Tax History Compared to Growth
Tax History
| Year | Tax Paid | Tax Assessment Tax Assessment Total Assessment is a certain percentage of the fair market value that is determined by local assessors to be the total taxable value of land and additions on the property. | Land | Improvement |
|---|---|---|---|---|
| 2024 | $6,922 | $147,420 | $27,825 | $119,595 |
| 2023 | $7,316 | $116,840 | $24,610 | $92,230 |
| 2022 | $7,263 | $116,830 | $24,605 | $92,225 |
| 2021 | $7,206 | $116,830 | $24,610 | $92,230 |
| 2020 | $7,613 | $109,200 | $23,000 | $86,210 |
| 2019 | $7,390 | $312,000 | $65,700 | $246,300 |
| 2018 | $1,375 | $108,400 | $23,000 | $85,400 |
| 2017 | $1,441 | $21,180 | $21,180 | $0 |
| 2016 | $1,430 | $21,180 | $21,180 | $0 |
| 2015 | $1,354 | $21,180 | $21,180 | $0 |
| 2014 | $1,354 | $19,780 | $19,780 | $0 |
Source: Public Records
Map
Nearby Homes
- 12647 Edgepark Cir
- 12694 Ionia Ct
- 19982 Westwood Dr
- 12385 Corinth Ct
- 19767 Dell Dr
- 12651 Alameda Dr
- 12539 Olympus Way
- 13237 Tomson Dr
- 13236 Tomson Dr
- 13066 Olympus Way
- 13156 Olympus Way
- 13099 Olympus Way
- 20469 Westwood Park Blvd
- 11179 Fawn Meadow Ln
- 14112 Settlers Way
- 19997 Idlewood Trail
- 11432 Pearl Rd
- 20050 Idlewood Trail
- 11499 Pearl Rd Unit A106
- 11479 Pearl Rd Unit A101
- 12353 Edgebrook Dr
- 12724 Edgeview Ln
- 12718 Edgeview Ln
- 12331 Edgebrook Dr
- 12674 Edgepark Cir
- 12668 Edgepark Cir
- 12682 Edgepark Cir
- 12712 Edgeview Ln
- 12307 Edgebrook Dr
- 12662 Edgepark Cir
- 12364 Edgebrook Dr
- 12708 Edgeview Ln
- 12382 Edgebrook Dr
- 12346 Edgebrook Dr
- 12402 Edgebrook Dr
- Sublot 80 Edgebrook Dr
- 12328 Edgebrook Dr
- 12283 Edgebrook Dr
- 12422 Edgebrook Dr
- 12729 Edgeview Ln