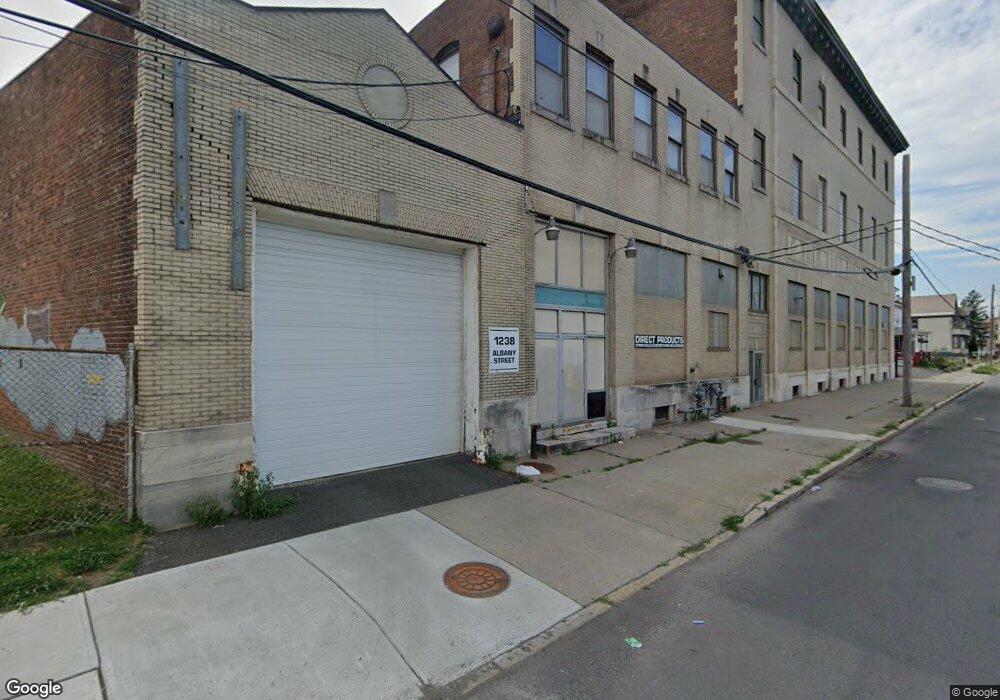
1238 Albany St Schenectady, NY 12304
Central State NeighborhoodEstimated Value: $450,380
--
Bed
--
Bath
30,167
Sq Ft
$15/Sq Ft
Est. Value
About This Home
This home is located at 1238 Albany St, Schenectady, NY 12304 and is currently estimated at $450,380, approximately $14 per square foot. 1238 Albany St is a home located in Schenectady County with nearby schools including William C Keane Elementary School, Central Park Middle School, and Schenectady High School.
Ownership History
Date
Name
Owned For
Owner Type
Purchase Details
Closed on
Feb 26, 2015
Sold by
Sure Glow Realty Of Albany, Llc
Bought by
Cajsd Llc
Current Estimated Value
Home Financials for this Owner
Home Financials are based on the most recent Mortgage that was taken out on this home.
Original Mortgage
$176,250
Outstanding Balance
$134,097
Interest Rate
3.66%
Mortgage Type
Purchase Money Mortgage
Estimated Equity
$316,283
Purchase Details
Closed on
Sep 30, 2005
Sold by
Freihofer Sales Co Inc
Bought by
Sure Glow Realty Of Alban Y Llc
Home Financials for this Owner
Home Financials are based on the most recent Mortgage that was taken out on this home.
Original Mortgage
$180,000
Interest Rate
5.78%
Mortgage Type
Commercial
Purchase Details
Closed on
Jan 1, 2001
Sold by
Charles Freihofer Baking Company Inc
Bought by
Freihofer Sales Company Inc
Create a Home Valuation Report for This Property
The Home Valuation Report is an in-depth analysis detailing your home's value as well as a comparison with similar homes in the area
Home Values in the Area
Average Home Value in this Area
Purchase History
| Date | Buyer | Sale Price | Title Company |
|---|---|---|---|
| Cajsd Llc | $229,000 | Craig Crist | |
| Cajsd Llc | $229,000 | Sneeringer Monahan Provost R | |
| Sure Glow Realty Of Alban Y Llc | $175,000 | Debra Lambek | |
| Freihofer Sales Company Inc | -- | -- |
Source: Public Records
Mortgage History
| Date | Status | Borrower | Loan Amount |
|---|---|---|---|
| Open | Cajsd Llc | $176,250 | |
| Previous Owner | Sure Glow Realty Of Alban Y Llc | $180,000 |
Source: Public Records
Tax History Compared to Growth
Tax History
| Year | Tax Paid | Tax Assessment Tax Assessment Total Assessment is a certain percentage of the fair market value that is determined by local assessors to be the total taxable value of land and additions on the property. | Land | Improvement |
|---|---|---|---|---|
| 2024 | $13,401 | $320,000 | $59,300 | $260,700 |
| 2023 | $13,207 | $320,000 | $59,300 | $260,700 |
| 2022 | $13,442 | $320,000 | $59,300 | $260,700 |
| 2021 | $13,408 | $320,000 | $59,300 | $260,700 |
| 2020 | $13,253 | $320,000 | $59,300 | $260,700 |
| 2019 | $6,623 | $320,000 | $59,300 | $260,700 |
| 2018 | $13,412 | $320,000 | $59,300 | $260,700 |
| 2017 | $13,901 | $320,000 | $59,300 | $260,700 |
| 2016 | $13,932 | $320,000 | $59,300 | $260,700 |
| 2015 | -- | $320,000 | $59,300 | $260,700 |
| 2014 | -- | $320,000 | $59,300 | $260,700 |
Source: Public Records
Map
Nearby Homes