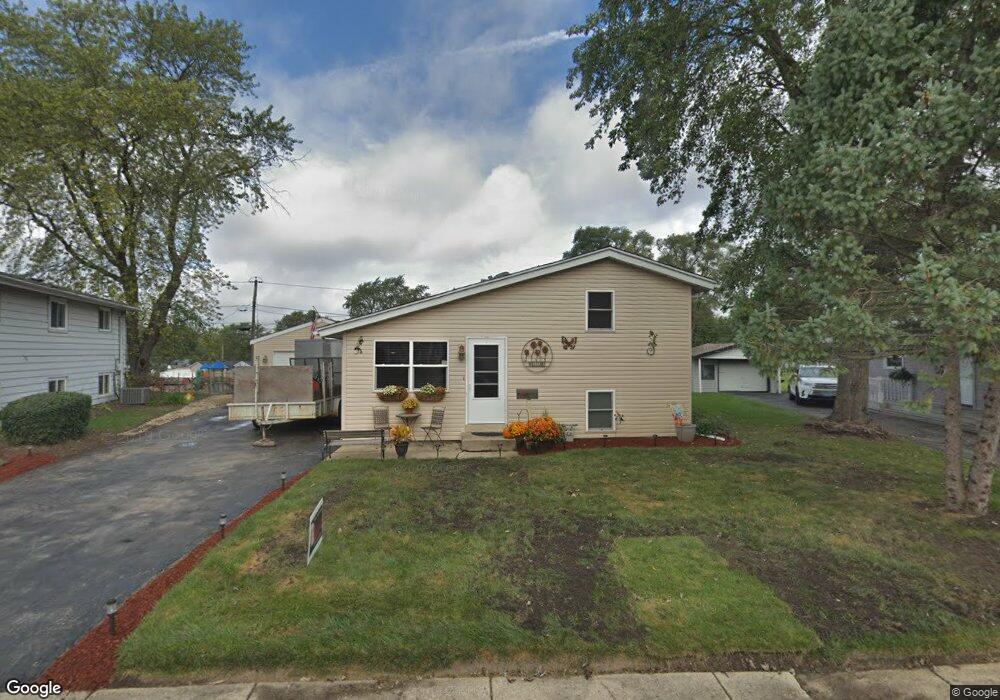
1238 Navajo Dr Carpentersville, IL 60110
Estimated Value: $273,675 - $291,000
4
Beds
--
Bath
1,628
Sq Ft
$175/Sq Ft
Est. Value
About This Home
This home is located at 1238 Navajo Dr, Carpentersville, IL 60110 and is currently estimated at $284,919, approximately $175 per square foot. 1238 Navajo Dr is a home located in Kane County with nearby schools including Sunny Hill Elementary School, Barrington Mdle School- Prairie Cmps, and Barrington High School.
Ownership History
Date
Name
Owned For
Owner Type
Purchase Details
Closed on
Sep 11, 2025
Sold by
Borst Katherine B and Lechman Katherine B
Bought by
Hecker Patricia A
Current Estimated Value
Home Financials for this Owner
Home Financials are based on the most recent Mortgage that was taken out on this home.
Original Mortgage
$143,075
Outstanding Balance
$143,075
Interest Rate
6.5%
Mortgage Type
New Conventional
Estimated Equity
$141,844
Purchase Details
Closed on
Feb 3, 2018
Sold by
Lechman Katherine B and Borst Katherine B
Bought by
Suwanski Javquelyn A and Lechman Adam J
Purchase Details
Closed on
Apr 2, 2004
Sold by
Lechman Richard J and Lechman Patricia A
Bought by
Lechman Richard J
Home Financials for this Owner
Home Financials are based on the most recent Mortgage that was taken out on this home.
Original Mortgage
$136,000
Interest Rate
7.45%
Mortgage Type
New Conventional
Create a Home Valuation Report for This Property
The Home Valuation Report is an in-depth analysis detailing your home's value as well as a comparison with similar homes in the area
Home Values in the Area
Average Home Value in this Area
Purchase History
| Date | Buyer | Sale Price | Title Company |
|---|---|---|---|
| Hecker Patricia A | $147,500 | None Listed On Document | |
| Suwanski Javquelyn A | -- | Attorney | |
| Lechman Richard J | -- | -- |
Source: Public Records
Mortgage History
| Date | Status | Borrower | Loan Amount |
|---|---|---|---|
| Open | Hecker Patricia A | $143,075 | |
| Previous Owner | Lechman Richard J | $136,000 |
Source: Public Records
Tax History Compared to Growth
Tax History
| Year | Tax Paid | Tax Assessment Tax Assessment Total Assessment is a certain percentage of the fair market value that is determined by local assessors to be the total taxable value of land and additions on the property. | Land | Improvement |
|---|---|---|---|---|
| 2024 | $5,406 | $77,956 | $12,553 | $65,403 |
| 2023 | $5,136 | $70,142 | $11,295 | $58,847 |
| 2022 | $4,679 | $60,471 | $11,295 | $49,176 |
| 2021 | $4,488 | $57,097 | $10,665 | $46,432 |
| 2020 | $4,275 | $55,813 | $10,425 | $45,388 |
| 2019 | $4,027 | $52,984 | $9,897 | $43,087 |
| 2018 | $3,862 | $49,162 | $9,701 | $39,461 |
| 2017 | $3,125 | $45,989 | $9,075 | $36,914 |
| 2016 | $2,753 | $40,230 | $8,787 | $31,443 |
| 2015 | -- | $35,492 | $8,234 | $27,258 |
| 2014 | -- | $31,672 | $8,007 | $23,665 |
| 2013 | -- | $30,868 | $8,252 | $22,616 |
Source: Public Records
Map
Nearby Homes
- 336 Delaware St
- 944 Cortney Dr
- 103 Hickory Dr
- 140 Hickory Dr
- 94 Wren Rd
- 1426 Kings Rd
- 57 Robin Rd
- 155 Helm Rd
- 105 Siesta Rd
- 1811 IL Rte 25 (Elgin) Rd
- 153 Algonquin Rd
- 7 Autumn Trail
- 200 Amarillo Dr
- 7 Hickory Dr
- 2013 Silverstone Dr Unit 2013
- 308 Amarillo Ct
- 2245 Flagstone Ln Unit 155
- 7 Austin Ave
- 1431 Silverstone Dr Unit 1416
- 4 Austin Ave
- 1236 Navajo Dr
- 1240 Navajo Dr
- 1242 Navajo Dr Unit 5
- 1234 Navajo Dr
- 1235 Navajo Dr
- 1244 Navajo Dr
- 1232 Navajo Dr
- 1233 Navajo Dr
- 1246 Navajo Dr Unit 5
- 1230 Navajo Dr
- 1429 Indian Ln
- 1427 Indian Ln
- 1431 Indian Ln
- 1425 Indian Ln
- 1433 Indian Ln
- 1231 Navajo Dr
- 1248 Navajo Dr Unit 5
- 1228 Navajo Dr
- 1423 Indian Ln
- 1435 Indian Ln