Estimated Value: $667,391 - $737,000
4
Beds
3
Baths
2,628
Sq Ft
$267/Sq Ft
Est. Value
About This Home
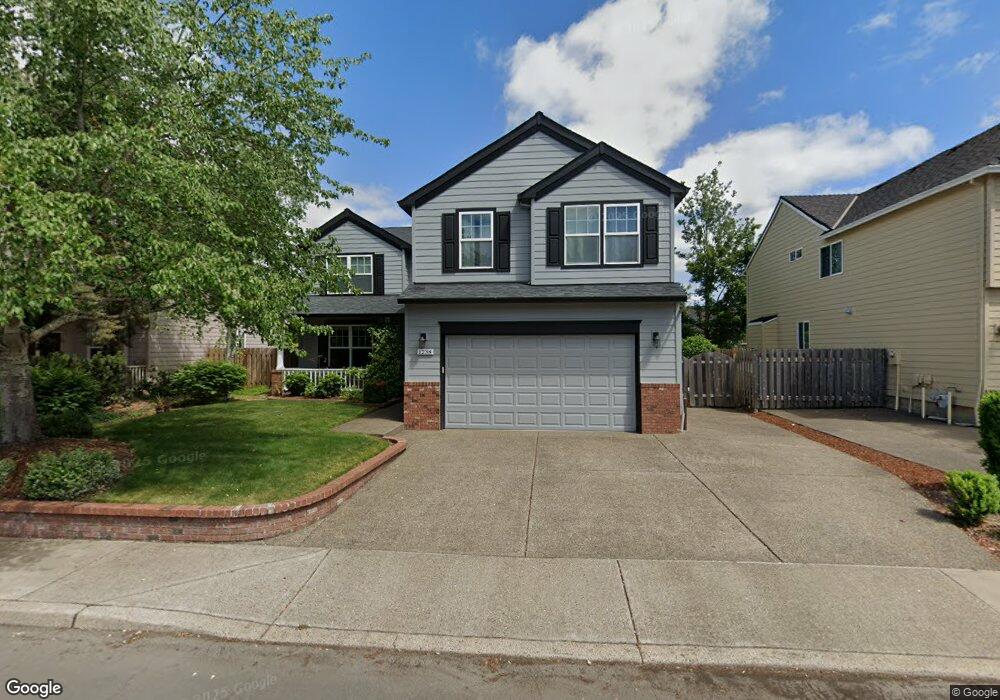
This home is located at 1238 SE 16th Ave, Canby, OR 97013 and is currently estimated at $702,848, approximately $267 per square foot. 1238 SE 16th Ave is a home located in Clackamas County with nearby schools including Josefa L. Sambrano Elementary School, Philander Lee Elementary School, and Baker Prairie Middle School.
Ownership History
Date
Name
Owned For
Owner Type
Purchase Details
Closed on
Jun 14, 2006
Sold by
Hoover David M and Hoover Nancy A
Bought by
Reed Scott E and Reed Lisa M
Current Estimated Value
Home Financials for this Owner
Home Financials are based on the most recent Mortgage that was taken out on this home.
Original Mortgage
$255,800
Outstanding Balance
$149,416
Interest Rate
6.55%
Mortgage Type
Fannie Mae Freddie Mac
Estimated Equity
$553,432
Purchase Details
Closed on
May 2, 2003
Sold by
Martin Joel J and Martin Julia T
Bought by
Hoover David M and Hoover Nancy A
Purchase Details
Closed on
Sep 15, 1998
Sold by
Pahlisch Nielsen Homes Llc
Bought by
Martin Joel J and Martin Julia T
Home Financials for this Owner
Home Financials are based on the most recent Mortgage that was taken out on this home.
Original Mortgage
$200,000
Interest Rate
6.89%
Purchase Details
Closed on
May 2, 1997
Sold by
Pahlisch Nielsen Homes Llc
Bought by
Pahlisch Nielsen Homes Llc
Create a Home Valuation Report for This Property
The Home Valuation Report is an in-depth analysis detailing your home's value as well as a comparison with similar homes in the area
Home Values in the Area
Average Home Value in this Area
Purchase History
| Date | Buyer | Sale Price | Title Company |
|---|---|---|---|
| Reed Scott E | $415,000 | Chicago Title Insurance Co | |
| Hoover David M | $278,000 | Transnation | |
| Martin Joel J | -- | Fidelity National Title Co | |
| Pahlisch Nielsen Homes Llc | -- | Fidelity National Title Co |
Source: Public Records
Mortgage History
| Date | Status | Borrower | Loan Amount |
|---|---|---|---|
| Open | Reed Scott E | $255,800 | |
| Previous Owner | Martin Joel J | $200,000 |
Source: Public Records
Tax History Compared to Growth
Tax History
| Year | Tax Paid | Tax Assessment Tax Assessment Total Assessment is a certain percentage of the fair market value that is determined by local assessors to be the total taxable value of land and additions on the property. | Land | Improvement |
|---|---|---|---|---|
| 2025 | $6,627 | $374,060 | -- | -- |
| 2024 | $6,441 | $363,166 | -- | -- |
| 2023 | $6,441 | $352,589 | $0 | $0 |
| 2022 | $5,925 | $342,320 | $0 | $0 |
| 2021 | $5,705 | $332,350 | $0 | $0 |
| 2020 | $5,603 | $322,670 | $0 | $0 |
| 2019 | $5,336 | $313,272 | $0 | $0 |
| 2018 | $5,217 | $304,148 | $0 | $0 |
| 2017 | $5,084 | $295,289 | $0 | $0 |
| 2016 | $4,915 | $286,688 | $0 | $0 |
| 2015 | $4,746 | $278,338 | $0 | $0 |
| 2014 | $4,609 | $270,231 | $0 | $0 |
Source: Public Records
Map
Nearby Homes
- 1827 S Pepperwood St
- 1821 S Pepperwood St
- 1825 S Pepperwood St
- 1823 S Pepperwood St
- 1357 SE 17th Ave
- 1143 SE 17th Ave
- 1220 SE 18th Place
- 1333 SE 14th Ave
- 1231 SE 18th Place
- 1305 SE 17th Ave
- 1321 SE 17th Ave
- 1409 S Maple St
- 1650 S Redwood St
- 1660 S Redwood St
- 1172 SE 18th Ave
- 1157 SE 18th Ave
- 1146 SE 18th Ave
- 1175 SE 18th Ave
- 1165 SE 18th Ave
- 1156 SE 18th Ave
- 1256 SE 16th Ave
- 1224 SE 16th Ave
- 1256 SE 16th Ave Bonus
- 1233 SE 15th Ave
- 1208 SE 16th Ave
- 1260 SE 16th Ave
- 1221 SE 15th Ave
- 1239 SE 15th Ave
- 1235 SE 16th Ave
- 1201 SE 15th Ave
- 1247 SE 15th Ave
- 1253 SE 16th Ave
- 1219 SE 16th Ave
- 1190 SE 16th Ave
- 1270 SE 16th Ave
- 1265 SE 16th Ave
- 1185 SE 15th Ave
- 1257 SE 15th Ave
- 1257 SE 15th Ave Bonus
- 1275 SE 16th Ave