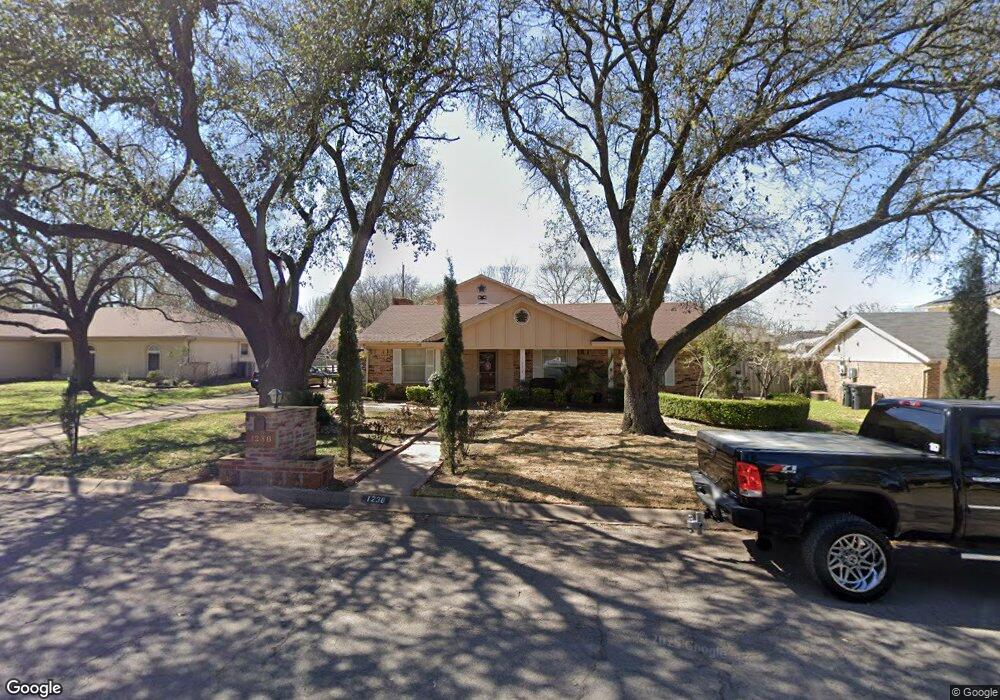
1238 Wedgewood Dr Cleburne, TX 76033
Estimated Value: $309,000 - $345,000
4
Beds
3
Baths
1,898
Sq Ft
$172/Sq Ft
Est. Value
About This Home
This home is located at 1238 Wedgewood Dr, Cleburne, TX 76033 and is currently estimated at $326,614, approximately $172 per square foot. 1238 Wedgewood Dr is a home located in Johnson County with nearby schools including Coleman Elementary School, Lowell Smith Jr. Middle School, and Cleburne High School.
Ownership History
Date
Name
Owned For
Owner Type
Purchase Details
Closed on
Dec 19, 2012
Sold by
Us Bank Na
Bought by
Tovar Antonio and Tovar Rosa
Current Estimated Value
Home Financials for this Owner
Home Financials are based on the most recent Mortgage that was taken out on this home.
Original Mortgage
$67,500
Interest Rate
3.38%
Mortgage Type
New Conventional
Purchase Details
Closed on
Aug 7, 2012
Sold by
Clark Shawn and Clark Kerri
Bought by
Us Bank Na
Purchase Details
Closed on
Sep 6, 2006
Sold by
Moss Jean
Bought by
Clark Shawn and Clark Kerri
Home Financials for this Owner
Home Financials are based on the most recent Mortgage that was taken out on this home.
Original Mortgage
$133,000
Interest Rate
9.5%
Mortgage Type
Adjustable Rate Mortgage/ARM
Create a Home Valuation Report for This Property
The Home Valuation Report is an in-depth analysis detailing your home's value as well as a comparison with similar homes in the area
Home Values in the Area
Average Home Value in this Area
Purchase History
| Date | Buyer | Sale Price | Title Company |
|---|---|---|---|
| Tovar Antonio | -- | Chicago Title Company | |
| Us Bank Na | $85,950 | None Available | |
| Clark Shawn | -- | Stnt |
Source: Public Records
Mortgage History
| Date | Status | Borrower | Loan Amount |
|---|---|---|---|
| Previous Owner | Tovar Antonio | $67,500 | |
| Previous Owner | Clark Shawn | $133,000 |
Source: Public Records
Tax History Compared to Growth
Tax History
| Year | Tax Paid | Tax Assessment Tax Assessment Total Assessment is a certain percentage of the fair market value that is determined by local assessors to be the total taxable value of land and additions on the property. | Land | Improvement |
|---|---|---|---|---|
| 2025 | $3,448 | $306,184 | $50,500 | $255,684 |
| 2024 | $4,832 | $216,730 | $0 | $0 |
| 2023 | $3,031 | $306,184 | $50,500 | $255,684 |
| 2022 | $4,483 | $244,243 | $42,500 | $201,743 |
| 2021 | $4,248 | $184,672 | $36,000 | $148,672 |
| 2020 | $4,102 | $165,845 | $25,000 | $140,845 |
| 2019 | $3,976 | $161,934 | $25,000 | $136,934 |
| 2018 | $3,616 | $161,934 | $25,000 | $136,934 |
| 2017 | $3,274 | $148,441 | $25,000 | $123,441 |
| 2016 | $2,976 | $131,833 | $20,000 | $111,833 |
| 2015 | $1,929 | $110,478 | $20,000 | $90,478 |
| 2014 | $1,929 | $83,558 | $20,000 | $63,558 |
Source: Public Records
Map
Nearby Homes
- 504 S Colonial Dr
- 800 Misty Ln
- 1225 Crestwood Dr
- 1204 W Westhill Dr
- 1309 Wedgewood Dr
- 709 Stonelake Dr
- 806 S Colonial Dr
- 1116 Willowcreek Rd
- 1211 Greenbriar Ln
- 1103 Trace Rd
- 1115 Green River Trail
- 325 Wildrose Cir
- 380 Wildrose Cir
- 840 S Ridgeway Dr
- 4112 Highland Dr
- 4101 Highland Dr
- 529 Marsh St
- 524 Crestridge Dr N
- 1208 Cindy Ln
- 909 Highland Dr
- 1236 Wedgewood Dr
- 1240 Wedgewood Dr
- 1245 Willowwood Dr
- 1243 Willowwood Dr
- 1247 Willowwood Dr
- 1235 Wedgewood Dr
- 1234 Wedgewood Dr
- 1241 Willowwood Dr
- 1242 Wedgewood Dr
- 1237 Wedgewood Dr
- 1233 Wedgewood Dr
- 1249 Willowwood Dr
- 1239 Willowwood Dr
- 1231 Wedgewood Dr
- 1232 Wedgewood Dr
- 1239 Wedgewood Dr
- 1251 Willowwood Dr
- 1244 Wedgewood Dr
- 1248 Willowwood Dr
- 1246 Willowwood Dr