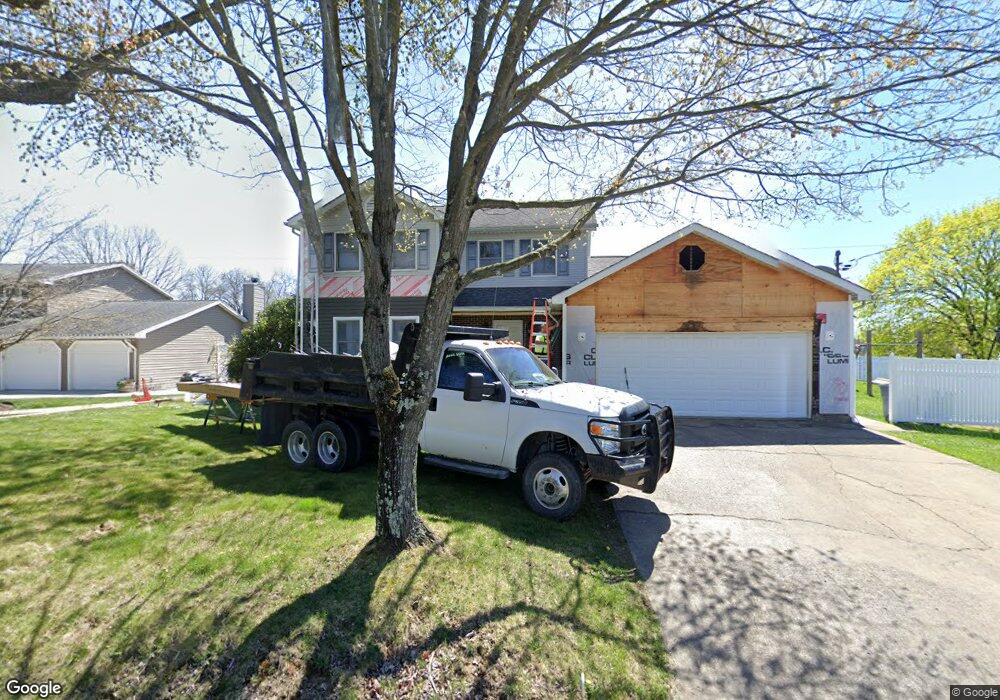
1239 Bakers Ridge Rd Morgantown, WV 26505
Estimated Value: $302,000 - $426,000
3
Beds
3
Baths
2,054
Sq Ft
$176/Sq Ft
Est. Value
About This Home
This home is located at 1239 Bakers Ridge Rd, Morgantown, WV 26505 and is currently estimated at $361,099, approximately $175 per square foot. 1239 Bakers Ridge Rd is a home located in Monongalia County with nearby schools including North Elementary School, Suncrest Middle School, and Morgantown High School.
Ownership History
Date
Name
Owned For
Owner Type
Purchase Details
Closed on
May 13, 2022
Sold by
Michael Ibrahim
Bought by
Bochna-Tuck Brandy Lynn and Tuck Andrew Rawlins
Current Estimated Value
Home Financials for this Owner
Home Financials are based on the most recent Mortgage that was taken out on this home.
Original Mortgage
$249,000
Outstanding Balance
$236,650
Interest Rate
5.3%
Mortgage Type
New Conventional
Estimated Equity
$124,449
Purchase Details
Closed on
Jun 23, 2016
Sold by
Burkholder David R and Burkholder Jennier Ann
Bought by
Ibrahim Michael and Hamilton Alexandra
Home Financials for this Owner
Home Financials are based on the most recent Mortgage that was taken out on this home.
Original Mortgage
$275,793
Interest Rate
3.58%
Mortgage Type
FHA
Purchase Details
Closed on
May 13, 2013
Sold by
Collins C Allan and Collins Darialouise Kay
Bought by
Burkholder David R and Burkholder Jennifer Ann
Create a Home Valuation Report for This Property
The Home Valuation Report is an in-depth analysis detailing your home's value as well as a comparison with similar homes in the area
Home Values in the Area
Average Home Value in this Area
Purchase History
| Date | Buyer | Sale Price | Title Company |
|---|---|---|---|
| Bochna-Tuck Brandy Lynn | $399,000 | Gianola Barnum & Jecklin Lc | |
| Ibrahim Michael | $305,000 | None Available | |
| Burkholder David R | $262,000 | None Available |
Source: Public Records
Mortgage History
| Date | Status | Borrower | Loan Amount |
|---|---|---|---|
| Open | Bochna-Tuck Brandy Lynn | $249,000 | |
| Previous Owner | Ibrahim Michael | $275,793 |
Source: Public Records
Tax History Compared to Growth
Tax History
| Year | Tax Paid | Tax Assessment Tax Assessment Total Assessment is a certain percentage of the fair market value that is determined by local assessors to be the total taxable value of land and additions on the property. | Land | Improvement |
|---|---|---|---|---|
| 2024 | $1,606 | $151,680 | $24,600 | $127,080 |
| 2023 | $1,616 | $127,860 | $24,600 | $103,260 |
| 2022 | $1,304 | $127,200 | $24,600 | $102,600 |
| 2021 | $1,310 | $127,200 | $24,600 | $102,600 |
| 2020 | $1,311 | $126,780 | $24,600 | $102,180 |
| 2019 | $1,321 | $126,780 | $24,600 | $102,180 |
| 2018 | $1,337 | $127,920 | $24,600 | $103,320 |
| 2017 | $1,183 | $112,620 | $23,220 | $89,400 |
| 2016 | $1,189 | $112,440 | $22,080 | $90,360 |
| 2015 | $1,119 | $110,700 | $20,340 | $90,360 |
| 2014 | $1,049 | $108,780 | $18,600 | $90,180 |
Source: Public Records
Map
Nearby Homes
- 129 Bakers Dr
- 65 Saint Clairs Village
- 47 Saint Clair's Village
- 89 Saint Clair's Village
- 101 Walnut Ln
- 3 Bakers Pointe
- 230 Poplar Dr
- 160 Poplar Dr
- 1641 van Voorhis Rd
- 81 Saint Clairs Village
- 1639 van Voorhis Rd
- 999 W Run Rd
- 127 Stanley St
- 148 Hawks Run Rd
- 521 Leah Dr
- 865 Quadrilla St
- 867 Quadrilla St
- 1510 Bergamont St
- 887 Tremont St
- 1422 Northwest Dr
- 1233 Bakers Ridge Rd
- 1253 Bakers Ridge Rd
- 1248 Bakers Ridge Rd
- 104 Scenery Dr
- 1225 Bakers Ridge Rd
- 108 Scenery Dr
- 1228 Bakers Ridge Rd
- 1256 Bakers Ridge Rd
- 1213 Bakers Ridge Rd
- 1266 Bakers Ridge Rd
- 103 Poplar Dr
- 108 Bakers Dr
- 109 Bakers Dr
- 1208 Bakers Ridge Rd
- 113 Scenery Dr
- 1189 Bakers Ridge Rd
- 1276 Bakers Ridge Rd
- 105 Poplar Dr
- 1277 Bakers Ridge Rd
- 106 Emerald Ct