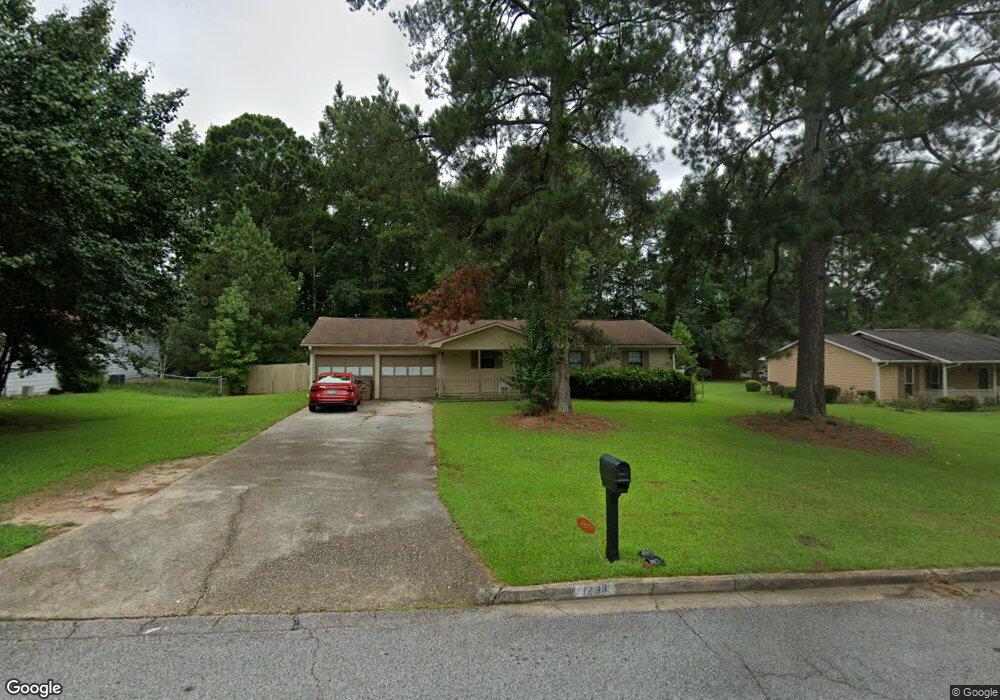
1239 Briar Ridge Ln Jonesboro, GA 30238
Estimated Value: $214,000 - $227,449
3
Beds
2
Baths
1,198
Sq Ft
$185/Sq Ft
Est. Value
About This Home
This home is located at 1239 Briar Ridge Ln, Jonesboro, GA 30238 and is currently estimated at $221,112, approximately $184 per square foot. 1239 Briar Ridge Ln is a home located in Clayton County with nearby schools including Kemp Primary School, Kemp Elementary School, and Mundys Mill Middle School.
Ownership History
Date
Name
Owned For
Owner Type
Purchase Details
Closed on
Aug 26, 2025
Sold by
Megahey Ann
Bought by
Samuel Taylor & Ann Taylor Living Trust and Taylor Samuel
Current Estimated Value
Purchase Details
Closed on
Feb 24, 2009
Sold by
Fannie Mae
Bought by
Bagwell Todd and Mcgahey Ann
Purchase Details
Closed on
Nov 4, 2008
Sold by
Phh Mortgage Corp
Bought by
Federal National Mortgage Association
Purchase Details
Closed on
Feb 28, 2005
Sold by
Durham Bykei
Bought by
Smith April L
Home Financials for this Owner
Home Financials are based on the most recent Mortgage that was taken out on this home.
Original Mortgage
$85,025
Interest Rate
5.6%
Mortgage Type
New Conventional
Purchase Details
Closed on
Feb 18, 2002
Sold by
Jones Elizabeth M
Bought by
Durham Bykei
Home Financials for this Owner
Home Financials are based on the most recent Mortgage that was taken out on this home.
Original Mortgage
$103,386
Interest Rate
6.86%
Mortgage Type
FHA
Purchase Details
Closed on
Apr 30, 1996
Sold by
Walker Jon Marsha
Bought by
Alves Paul and Jones Elizabeth
Create a Home Valuation Report for This Property
The Home Valuation Report is an in-depth analysis detailing your home's value as well as a comparison with similar homes in the area
Home Values in the Area
Average Home Value in this Area
Purchase History
| Date | Buyer | Sale Price | Title Company |
|---|---|---|---|
| Samuel Taylor & Ann Taylor Living Trust | -- | -- | |
| Bagwell Todd | -- | -- | |
| Federal National Mortgage Association | -- | -- | |
| Phh Mortgage Corp | $92,743 | -- | |
| Smith April L | $89,500 | -- | |
| Durham Bykei | $104,700 | -- | |
| Alves Paul | $75,900 | -- |
Source: Public Records
Mortgage History
| Date | Status | Borrower | Loan Amount |
|---|---|---|---|
| Previous Owner | Smith April L | $85,025 | |
| Previous Owner | Durham Bykei | $103,386 |
Source: Public Records
Tax History Compared to Growth
Tax History
| Year | Tax Paid | Tax Assessment Tax Assessment Total Assessment is a certain percentage of the fair market value that is determined by local assessors to be the total taxable value of land and additions on the property. | Land | Improvement |
|---|---|---|---|---|
| 2024 | $2,735 | $69,200 | $8,800 | $60,400 |
| 2023 | $2,439 | $67,560 | $8,800 | $58,760 |
| 2022 | $1,881 | $47,040 | $8,800 | $38,240 |
| 2021 | $1,106 | $42,080 | $8,800 | $33,280 |
| 2020 | $1,120 | $27,125 | $8,800 | $18,325 |
| 2019 | $1,300 | $31,172 | $5,600 | $25,572 |
| 2018 | $1,144 | $27,308 | $5,600 | $21,708 |
| 2017 | $958 | $22,691 | $5,600 | $17,091 |
| 2016 | $837 | $19,702 | $5,600 | $14,102 |
| 2015 | $830 | $0 | $0 | $0 |
| 2014 | $799 | $19,218 | $5,600 | $13,618 |
Source: Public Records
Map
Nearby Homes
- 1358 Riverstone Rd Unit 102
- 9468 Briarwood Ln
- 1255 Meadowbrook Dr
- 1256 Riverstone Rd
- 1274 Riverstone Rd
- 1254 Meadowbrook Drive Unit#179
- 1352 Riverstone Rd Unit 104
- 1364 Riverstone Rd Unit 99
- 1366 Riverstone Rd Unit 98
- 1362 Riverstone Rd Unit LOT 100
- 1366 Riverstone Rd
- 1360 Riverstone Rd Unit LOT 101
- 1352 Riverstone Rd
- 1239 Riverstone Rd
- 1262 Riverstone Rd
- 1234 Riverstone Rd
- 1250 Riverstone Rd
- 1256 Meadowbrook Dr
- 1251 Briar Ridge Ln
- 1231 Briar Ridge Ln Unit 2
- 9552 Briar Creek Ct Unit 2
- 1263 Briar Ridge Ln
- 9562 Briar Creek Ct
- 0 Briar Creek Ct Unit 8805697
- 0 Briar Creek Ct Unit 7336644
- 9579 Briar Creek Ln
- 1244 Briar Ridge Ln
- 1234 Briar Ridge Ln
- 1234 Briar Ridge Ln Unit 1234
- 1275 Briar Ridge Ln
- 1256 Briar Ridge Ln
- 9575 Briar Creek Ln Unit II
- 0 Briar Ridge Ln Unit 7291204
- 0 Briar Ridge Ln Unit 7209001
- 0 Briar Ridge Ln Unit 3110783
- 1226 Briar Ridge Ln
- 9569 Briar Creek Ln
- 9539 Briar Creek Ct