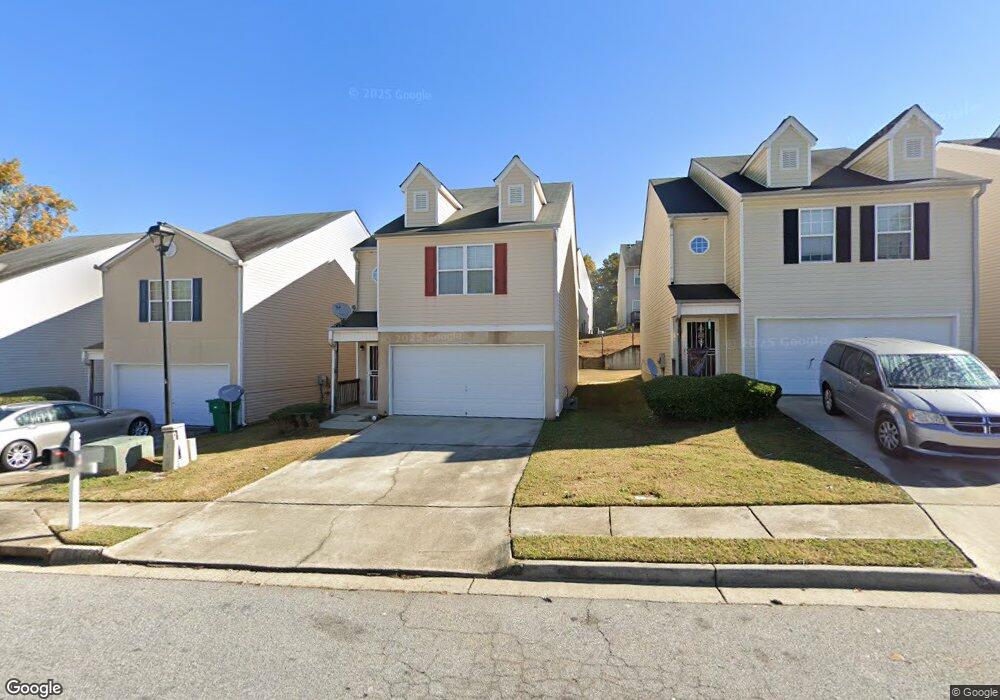
1239 Brookstone Rd Unit 15 Atlanta, GA 30349
Estimated Value: $230,000 - $255,000
3
Beds
3
Baths
1,768
Sq Ft
$135/Sq Ft
Est. Value
About This Home
This home is located at 1239 Brookstone Rd Unit 15, Atlanta, GA 30349 and is currently estimated at $239,464, approximately $135 per square foot. 1239 Brookstone Rd Unit 15 is a home located in Clayton County with nearby schools including West Clayton Elementary School, North Clayton Middle School, and North Clayton High School.
Ownership History
Date
Name
Owned For
Owner Type
Purchase Details
Closed on
Apr 13, 2023
Sold by
Saunders Derek
Bought by
Michel Widnie
Current Estimated Value
Home Financials for this Owner
Home Financials are based on the most recent Mortgage that was taken out on this home.
Original Mortgage
$235,653
Outstanding Balance
$229,128
Interest Rate
6.62%
Mortgage Type
FHA
Estimated Equity
$10,336
Purchase Details
Closed on
Jan 29, 2018
Sold by
Ward Robert G
Bought by
Saunders Derek
Home Financials for this Owner
Home Financials are based on the most recent Mortgage that was taken out on this home.
Original Mortgage
$86,858
Interest Rate
4.37%
Mortgage Type
FHA
Purchase Details
Closed on
Oct 31, 2008
Sold by
Southern Community Bank
Bought by
Ward Robert G and Ward Tracy A
Home Financials for this Owner
Home Financials are based on the most recent Mortgage that was taken out on this home.
Original Mortgage
$84,000
Interest Rate
5.78%
Mortgage Type
New Conventional
Create a Home Valuation Report for This Property
The Home Valuation Report is an in-depth analysis detailing your home's value as well as a comparison with similar homes in the area
Home Values in the Area
Average Home Value in this Area
Purchase History
| Date | Buyer | Sale Price | Title Company |
|---|---|---|---|
| Michel Widnie | $240,000 | -- | |
| Saunders Derek | $97,000 | -- | |
| Ward Robert G | $105,000 | -- |
Source: Public Records
Mortgage History
| Date | Status | Borrower | Loan Amount |
|---|---|---|---|
| Open | Michel Widnie | $235,653 | |
| Previous Owner | Saunders Derek | $86,858 | |
| Previous Owner | Ward Robert G | $84,000 |
Source: Public Records
Tax History Compared to Growth
Tax History
| Year | Tax Paid | Tax Assessment Tax Assessment Total Assessment is a certain percentage of the fair market value that is determined by local assessors to be the total taxable value of land and additions on the property. | Land | Improvement |
|---|---|---|---|---|
| 2024 | $3,746 | $95,040 | $7,200 | $87,840 |
| 2023 | $2,199 | $87,840 | $7,200 | $80,640 |
| 2022 | $2,548 | $73,960 | $7,200 | $66,760 |
| 2021 | $1,656 | $50,960 | $7,200 | $43,760 |
| 2020 | $1,475 | $45,928 | $7,200 | $38,728 |
| 2019 | $1,112 | $36,465 | $6,400 | $30,065 |
| 2018 | $1,432 | $34,345 | $6,400 | $27,945 |
| 2017 | $1,206 | $28,702 | $6,400 | $22,302 |
| 2016 | $1,215 | $28,934 | $6,400 | $22,534 |
| 2015 | $1,196 | $0 | $0 | $0 |
| 2014 | $1,124 | $27,307 | $6,400 | $20,907 |
Source: Public Records
Map
Nearby Homes
- 1267 Brookstone Rd
- 5446 Waterfall Ct
- 1145 Brookstone Rd
- 5405 Glen Haven Dr
- 1114 Summer Brook Rd
- 5407 Glen Haven Dr
- 5426 Glen Haven Dr
- 5428 Glen Haven Dr
- 1292 Crystal Lake Rd
- 5549 Pine Gate Dr
- 1103 Hidden Brook Trail
- 5575 Pine Gate Dr
- 5289 Brentwood Rd
- 5312 Heather Ln
- 5229 Kirk Dr
- 5697 Hidden Brook Cir
- 5721 Hidden Brook Cir
- 1303 Flat Shoals Rd
- 1239 Brookstone Rd
- 1243 Brookstone Rd
- 1235 Brookstone Rd Unit 16
- 1235 Brookstone Rd
- 1231 Brookstone Rd
- 1247 Brookstone Rd
- 5429 Waterfall Ct
- 1251 Brookstone Rd
- 1227 Brookstone Rd
- 5433 Waterfall Ct
- 5425 Waterfall Ct
- 5437 Waterfall Ct
- 1255 Brookstone Rd
- 1255 Brookstone Rd Unit 1255
- 1223 Brookstone Rd
- 5441 Waterfall Ct
- 5421 Waterfall Ct
- 1242 Brookstone Rd
- 1238 Brookstone Rd
- 1246 Brookstone Rd