1239 Channing Way Berkeley, CA 94702
West Berkeley NeighborhoodEstimated Value: $968,000 - $1,396,000
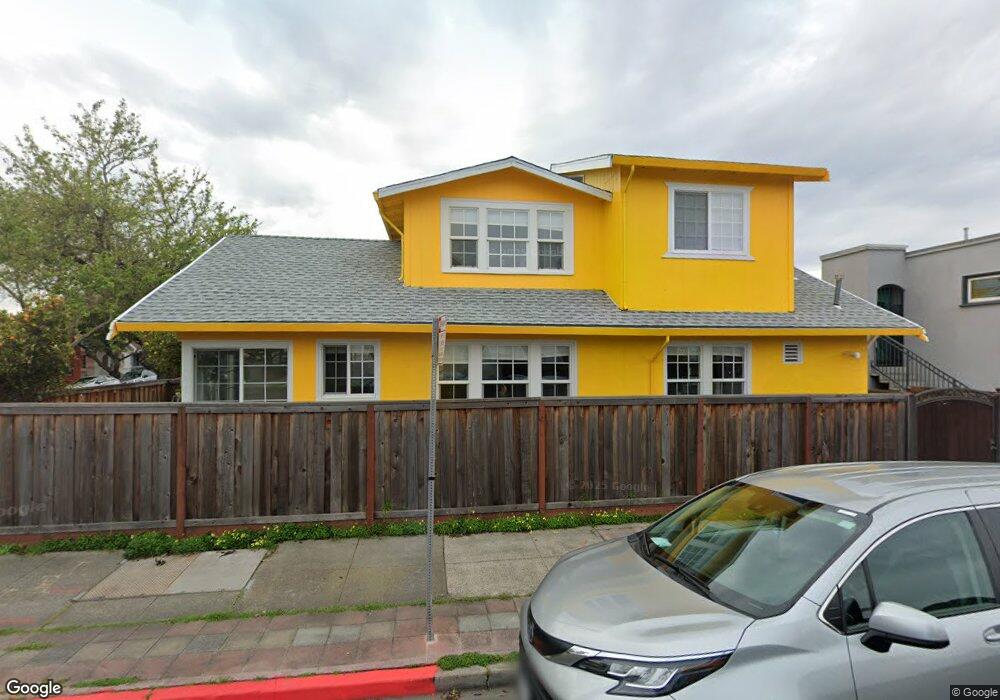
About This Home
This home is located at 1239 Channing Way, Berkeley, CA 94702 and is currently estimated at $1,145,081, approximately $894 per square foot. 1239 Channing Way is a home located in Alameda County with nearby schools including Rosa Parks Elementary School, Ruth Acty Elementary, and Berkeley Arts Magnet at Whittier School.
Ownership History
We collect this data history from publicly available records. To have your information removed, we recommend requesting removal directly through your county’s website.
Purchase Details
Home Financials for this Owner
Home Financials are based on the most recent Mortgage that was taken out on this home.Purchase Details
Home Financials for this Owner
Home Financials are based on the most recent Mortgage that was taken out on this home.Purchase Details
Home Financials for this Owner
Home Financials are based on the most recent Mortgage that was taken out on this home.Home Values in the Area
Average Home Value in this Area
Purchase History
We collect this data history from publicly available records. To have your information removed, we recommend requesting removal directly through your county’s website.
| Date | Buyer | Sale Price | Title Company |
|---|---|---|---|
| $229,000 | Alliance Title Company | ||
| $290,000 | North American Title Co | ||
| -- | Chicago Title Company |
Mortgage History
We collect this data history from publicly available records. To have your information removed, we recommend requesting removal directly through your county’s website.
| Date | Status | Borrower | Loan Amount |
|---|---|---|---|
| Open | $229,000 | ||
| Closed | $232,000 | ||
| Previous Owner | $71,000 |
Tax History
We collect this data history from publicly available records. To have your information removed, we recommend requesting removal directly through your county’s website.
| Year | Tax Paid | Tax Assessment Tax Assessment Total Assessment is a certain percentage of the fair market value that is determined by local assessors to be the total taxable value of land and additions on the property. | Land | Improvement |
|---|---|---|---|---|
| 2025 | $7,514 | $428,387 | $128,516 | $299,871 |
| 2024 | $7,514 | $419,988 | $125,996 | $293,992 |
| 2023 | $7,347 | $411,755 | $123,526 | $288,229 |
| 2022 | $7,194 | $403,682 | $121,104 | $282,578 |
| 2021 | $7,196 | $395,768 | $118,730 | $277,038 |
| 2020 | $6,763 | $391,711 | $117,513 | $274,198 |
| 2019 | $6,445 | $384,031 | $115,209 | $268,822 |
| 2018 | $6,325 | $376,503 | $112,951 | $263,552 |
| 2017 | $6,091 | $369,123 | $110,737 | $258,386 |
| 2016 | $5,857 | $361,887 | $108,566 | $253,321 |
| 2015 | $5,774 | $356,453 | $106,936 | $249,517 |
| 2014 | $5,721 | $349,472 | $104,841 | $244,631 |
Map
- 2426 West St
- 2207 Bonar St
- 2210 Browning St
- 1108 Dwight Way
- 2220 Acton St
- 2327 10th St Unit 4
- 2144 Curtis St
- 2241 Ninth St
- 1545 Dwight Way
- 1544 Channing Way
- 1595 Dwight Way
- 2238 California St
- 2418 Jefferson Ave
- 2709 10th St Unit C
- 1207 University Ave
- 1919 Curtis St
- 1239 Berkeley Way
- 2212 Jefferson Ave
- 2411 Sixth St
- 1536 Carleton St
- 1237 Channing Way
- 2340 Bonar St
- 1235 Channing Way
- 1301 Channing Way
- 2400 Bonar St
- 1231 Channing Way
- 1303 Channing Way
- 2336 Bonar St
- 2402 Bonar St
- 1229 Channing Way
- 1236 Channing Way
- 2339 Bonar St
- 1307 Channing Way
- 2334 Bonar St
- 1300 Channing Way
- 1232 Channing Way
- 2406 Bonar St
- 1227 Channing Way
- 2341 Browning St
- 2335 Bonar St
Ask me questions while you tour the home.