Estimated Value: $116,000 - $164,000
3
Beds
2
Baths
1,222
Sq Ft
$118/Sq Ft
Est. Value
About This Home
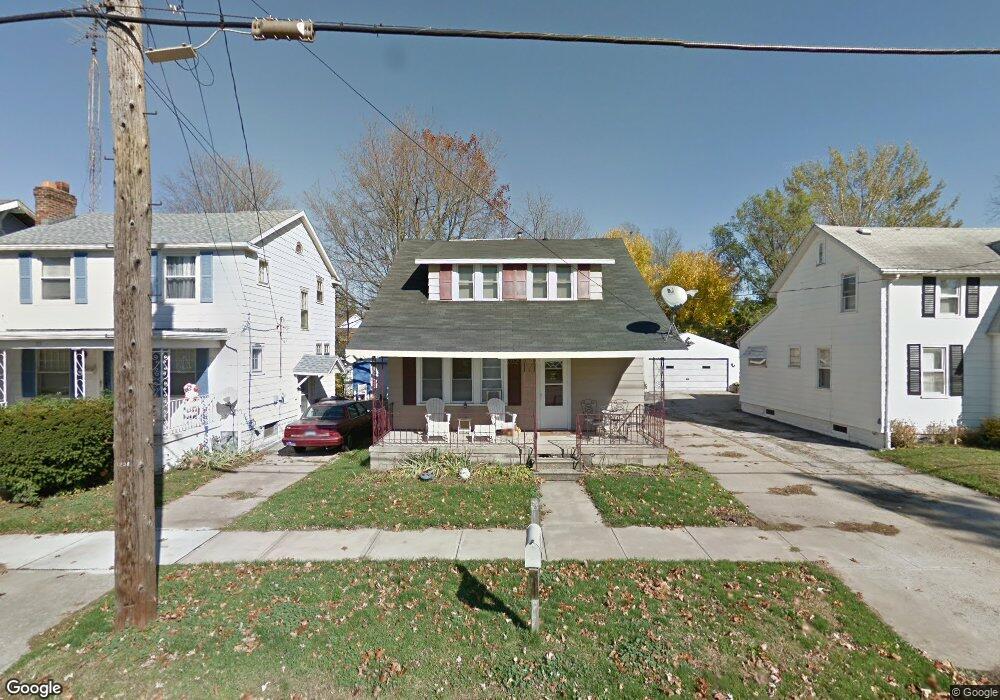
This home is located at 1239 E Main St, Niles, MI 49120 and is currently estimated at $144,092, approximately $117 per square foot. 1239 E Main St is a home located in Berrien County with nearby schools including James Ellis School, Howard-Ellis Elementary School, and Oak Manor Sixth Grade Center.
Ownership History
Date
Name
Owned For
Owner Type
Purchase Details
Closed on
Jan 22, 2014
Sold by
Makepeace Jeffery L and Makepeace Robin J
Bought by
Hessey Ryan M and Hessey Lindsey M
Current Estimated Value
Purchase Details
Closed on
Aug 5, 1999
Purchase Details
Closed on
Jul 14, 1999
Purchase Details
Closed on
Sep 17, 1998
Purchase Details
Closed on
Apr 26, 1993
Purchase Details
Closed on
Jan 15, 1993
Purchase Details
Closed on
Nov 3, 1987
Purchase Details
Closed on
Jun 14, 1985
Purchase Details
Closed on
Apr 19, 1978
Create a Home Valuation Report for This Property
The Home Valuation Report is an in-depth analysis detailing your home's value as well as a comparison with similar homes in the area
Home Values in the Area
Average Home Value in this Area
Purchase History
| Date | Buyer | Sale Price | Title Company |
|---|---|---|---|
| Hessey Ryan M | -- | First American Title | |
| -- | $30,000 | -- | |
| -- | $19,900 | -- | |
| -- | $36,800 | -- | |
| -- | $30,000 | -- | |
| -- | $100 | -- | |
| -- | $20,000 | -- | |
| -- | $30,000 | -- | |
| -- | $100 | -- | |
| -- | $20,000 | -- |
Source: Public Records
Tax History
| Year | Tax Paid | Tax Assessment Tax Assessment Total Assessment is a certain percentage of the fair market value that is determined by local assessors to be the total taxable value of land and additions on the property. | Land | Improvement |
|---|---|---|---|---|
| 2025 | $1,505 | $69,700 | $0 | $0 |
| 2024 | $1,182 | $64,900 | $0 | $0 |
| 2023 | $1,134 | $55,600 | $0 | $0 |
| 2022 | $1,080 | $51,800 | $0 | $0 |
| 2021 | $1,324 | $48,300 | $2,500 | $45,800 |
| 2020 | $1,310 | $37,900 | $0 | $0 |
| 2019 | $1,294 | $40,500 | $6,800 | $33,700 |
| 2018 | $1,251 | $40,500 | $0 | $0 |
| 2017 | $1,230 | $37,700 | $0 | $0 |
| 2016 | $1,204 | $35,700 | $0 | $0 |
| 2015 | $1,201 | $31,900 | $0 | $0 |
| 2014 | $888 | $31,800 | $0 | $0 |
Source: Public Records
Map
Nearby Homes
Your Personal Tour Guide
Ask me questions while you tour the home.