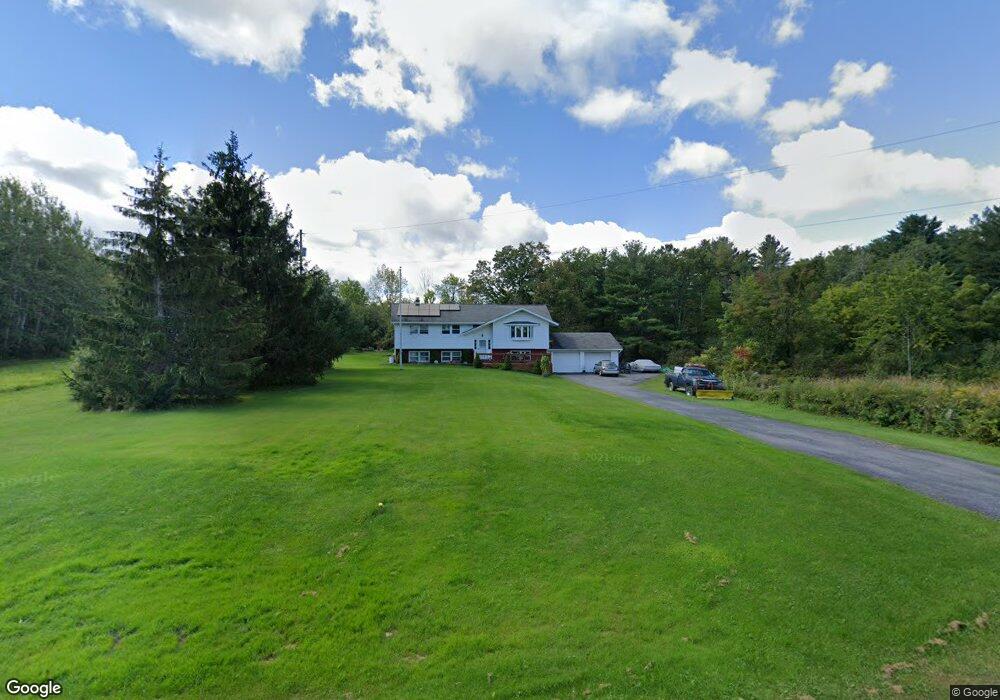
1239 Knox Cave Rd Delanson, NY 12053
Estimated Value: $344,534 - $478,000
5
Beds
3
Baths
2,420
Sq Ft
$181/Sq Ft
Est. Value
About This Home
This home is located at 1239 Knox Cave Rd, Delanson, NY 12053 and is currently estimated at $438,134, approximately $181 per square foot. 1239 Knox Cave Rd is a home located in Albany County with nearby schools including Berne-Knox-Westerlo Elementary School and Berne-Knox-Westerlo Junior/Senior High School.
Ownership History
Date
Name
Owned For
Owner Type
Purchase Details
Closed on
Feb 18, 2010
Sold by
Brookfield Global Relocation Services Ll
Bought by
Fox Brian P and Fox Gloria J
Current Estimated Value
Home Financials for this Owner
Home Financials are based on the most recent Mortgage that was taken out on this home.
Original Mortgage
$171,804
Outstanding Balance
$116,346
Interest Rate
5.5%
Mortgage Type
FHA
Estimated Equity
$321,788
Purchase Details
Closed on
Nov 18, 2009
Sold by
Rafferty Kevin
Bought by
Brookfield Global Relocation Services Ll
Purchase Details
Closed on
Apr 2, 2007
Sold by
Swint Todd M
Bought by
Rafferty Kevin
Home Financials for this Owner
Home Financials are based on the most recent Mortgage that was taken out on this home.
Original Mortgage
$168,319
Interest Rate
6.25%
Purchase Details
Closed on
Apr 21, 2000
Sold by
Derocher Ronald W
Bought by
Swint Todd M
Create a Home Valuation Report for This Property
The Home Valuation Report is an in-depth analysis detailing your home's value as well as a comparison with similar homes in the area
Home Values in the Area
Average Home Value in this Area
Purchase History
| Date | Buyer | Sale Price | Title Company |
|---|---|---|---|
| Fox Brian P | $175,000 | None Available | |
| Brookfield Global Relocation Services Ll | $175,000 | None Available | |
| Rafferty Kevin | $169,650 | Cindy Dixon | |
| Rafferty Kevin | $170,000 | None Available | |
| Swint Todd M | $110,000 | Peter Ford |
Source: Public Records
Mortgage History
| Date | Status | Borrower | Loan Amount |
|---|---|---|---|
| Open | Fox Brian P | $171,804 | |
| Previous Owner | Rafferty Kevin | $168,319 |
Source: Public Records
Tax History Compared to Growth
Tax History
| Year | Tax Paid | Tax Assessment Tax Assessment Total Assessment is a certain percentage of the fair market value that is determined by local assessors to be the total taxable value of land and additions on the property. | Land | Improvement |
|---|---|---|---|---|
| 2024 | $4,560 | $112,600 | $8,000 | $104,600 |
| 2023 | $4,551 | $112,600 | $8,000 | $104,600 |
| 2022 | $4,568 | $112,600 | $8,000 | $104,600 |
| 2021 | $4,292 | $112,600 | $8,000 | $104,600 |
| 2020 | $4,269 | $112,600 | $8,000 | $104,600 |
| 2019 | $2,708 | $112,600 | $8,000 | $104,600 |
| 2018 | $4,339 | $112,600 | $8,000 | $104,600 |
| 2017 | $4,181 | $112,600 | $8,000 | $104,600 |
| 2016 | $4,170 | $112,600 | $8,000 | $104,600 |
| 2015 | -- | $112,600 | $8,000 | $104,600 |
| 2014 | -- | $112,600 | $8,000 | $104,600 |
Source: Public Records
Map
Nearby Homes
- 87 Craven Rd
- 87 Craven Rd
- 1927 Berne Altamont Rd
- L14 State Route 146 & Township Rd
- 25 Pleasant Valley Rd
- 581 Salsburg Rd
- 233 Maple Ave
- 529 Duane Lake Rd
- L41 N Mansion Rd
- 1070 Gallupville Gallupville Rd
- 147 E Shore Rd
- 1942 Main St
- 6991 Duanesburg Rd
- L27 Duanesburg Rd
- 2 Harold Dr
- L4 L4 Depot Rd
- L2 Depot Rd
- L1 Depot Rd
- L4 Depot Rd
- L3 Depot Rd
- 11 Dogwood Dr
- 11 Dogwood La
- 11 Dogwood Ln
- 1251 Knox Cave Rd
- 12 Dogwood Dr
- 1718 Township Rd
- 6 Dogwood Dr
- 1690 Township Rd
- 1320 Knox Cave Rd
- 45.-1-21 Township Rd
- 1701 Township Rd
- 1892 Knox Cave Rd
- 1262 Knox Cave Rd
- 1205 Knox Cave Rd
- 1205 Knox Cave Rd
- 1280 Knox Cave Rd
- 1660 Township Rd
- 1752 Township Rd
- 1185 Knox Cave Rd
- 1179 Knox Cave Rd