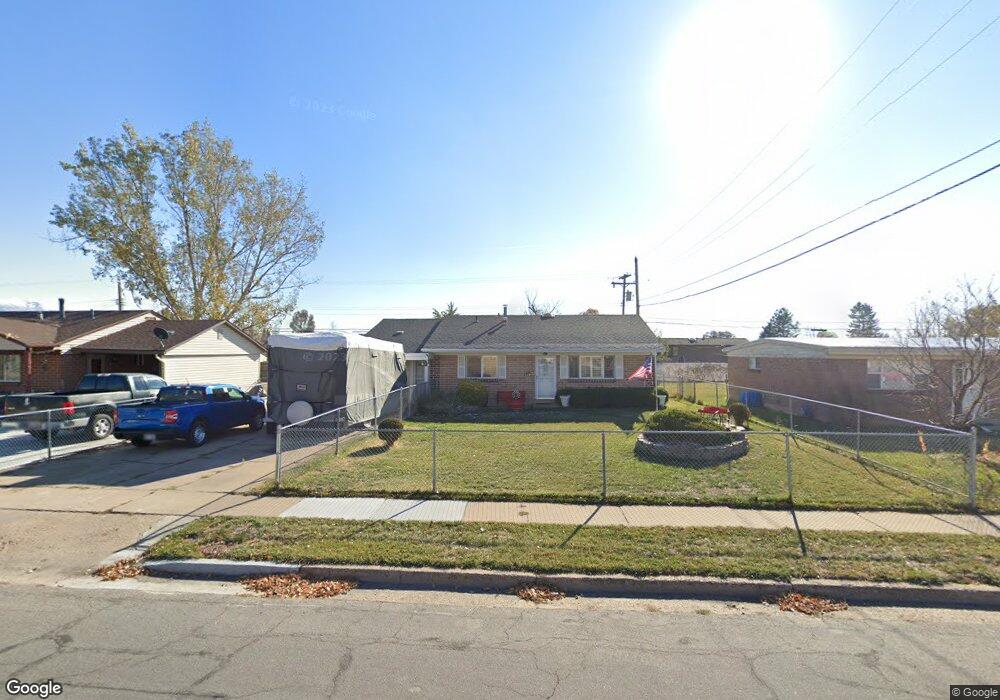
1239 Marilyn Dr Layton, UT 84041
Estimated Value: $356,000 - $408,000
3
Beds
1
Bath
1,054
Sq Ft
$360/Sq Ft
Est. Value
About This Home
This home is located at 1239 Marilyn Dr, Layton, UT 84041 and is currently estimated at $379,913, approximately $360 per square foot. 1239 Marilyn Dr is a home located in Davis County with nearby schools including Vae View Elementary School, Central Davis Junior High School, and Layton High School.
Ownership History
Date
Name
Owned For
Owner Type
Purchase Details
Closed on
Aug 26, 2021
Sold by
Strand Orlanda M and Strand Darwin J
Bought by
Strand Orlanda M and Strand Darwin J
Current Estimated Value
Home Financials for this Owner
Home Financials are based on the most recent Mortgage that was taken out on this home.
Original Mortgage
$499,500
Interest Rate
2.74%
Mortgage Type
Reverse Mortgage Home Equity Conversion Mortgage
Purchase Details
Closed on
Sep 10, 2018
Sold by
Strand Rolanda M
Bought by
Strand Rolanda M and Strand Darwin J
Home Financials for this Owner
Home Financials are based on the most recent Mortgage that was taken out on this home.
Original Mortgage
$315,000
Interest Rate
4.57%
Mortgage Type
Reverse Mortgage Home Equity Conversion Mortgage
Purchase Details
Closed on
Dec 13, 2013
Sold by
Strand Darwin J
Bought by
Strand Rolanda M
Purchase Details
Closed on
Nov 14, 2002
Sold by
Strand Shirley A
Bought by
Strand Rolanda M and Strand Darwin J
Create a Home Valuation Report for This Property
The Home Valuation Report is an in-depth analysis detailing your home's value as well as a comparison with similar homes in the area
Home Values in the Area
Average Home Value in this Area
Purchase History
| Date | Buyer | Sale Price | Title Company |
|---|---|---|---|
| Strand Orlanda M | -- | Timios Inc | |
| Strand Rolanda M | -- | Placer Title Agency | |
| Strand Rolanda M | -- | None Available | |
| Strand Rolanda M | -- | Title West Title Company |
Source: Public Records
Mortgage History
| Date | Status | Borrower | Loan Amount |
|---|---|---|---|
| Closed | Strand Orlanda M | $499,500 | |
| Closed | Strand Rolanda M | $315,000 |
Source: Public Records
Tax History
| Year | Tax Paid | Tax Assessment Tax Assessment Total Assessment is a certain percentage of the fair market value that is determined by local assessors to be the total taxable value of land and additions on the property. | Land | Improvement |
|---|---|---|---|---|
| 2025 | $201 | $190,850 | $100,178 | $90,672 |
| 2024 | $198 | $186,450 | $119,689 | $66,761 |
| 2023 | $204 | $320,000 | $158,359 | $161,641 |
| 2022 | $303 | $198,550 | $73,674 | $124,876 |
| 2021 | $255 | $267,000 | $103,986 | $163,014 |
| 2020 | $169 | $213,000 | $76,134 | $136,866 |
| 2019 | $23 | $208,000 | $73,208 | $134,792 |
| 2018 | $0 | $182,000 | $67,785 | $114,215 |
| 2016 | $529 | $77,661 | $19,674 | $57,987 |
| 2015 | $986 | $67,101 | $19,674 | $47,427 |
| 2014 | $1,111 | $79,182 | $19,674 | $59,508 |
| 2013 | -- | $66,622 | $19,646 | $46,976 |
Source: Public Records
Map
Nearby Homes
- 1358 Marilyn Dr
- 1187 W Seraphim Ct
- Fremont Plan at Trailside - Townhomes
- Oakridge Plan at Trailside - Townhomes
- Arlington Plan at Trailside - Townhomes
- Wilmington Plan at Trailside - Townhomes
- 1171 W Gordon Ave
- 2600 N Hill Rd Unit 19
- 1615 N Angel St Unit F
- 1615 N Angel St Unit I
- 1615 N Angel St Unit E
- 1615 N Angel St
- 1615 N Angel St Unit C
- 1615 N Angel St Unit H
- 1615 N Angel St Unit D
- 1500 N Angel St Unit 12
- 1500 N Angel St Unit 22
- 1627 N Angel St
- 1676 N Main St
- 1366 N Main St Unit 5
- 1257 W Marilyn Dr
- 1257 Marilyn Dr
- 1290 W 1200 N
- 1269 Marilyn Dr
- 1213 Marilyn Dr
- 1274 W 1200 N
- 1304 W 1200 N
- 1284 Nalder St
- 1238 Marilyn Dr
- 1260 W 1200 N
- 1287 Marilyn Dr
- 1203 Marilyn Dr
- 1228 Marilyn Dr
- 1318 W 1200 N
- 1214 N Marilyn Dr
- 1268 Marilyn Dr
- 1214 Marilyn Dr
- 1227 Nalder St
- 1213 Nalder St
- 1203 Nalder St
Your Personal Tour Guide
Ask me questions while you tour the home.