T
Landlord's Agent in 2023
Tanika Tanika Ford
Progress Residential Property Manager, LLC.
Estimated Value: $322,430
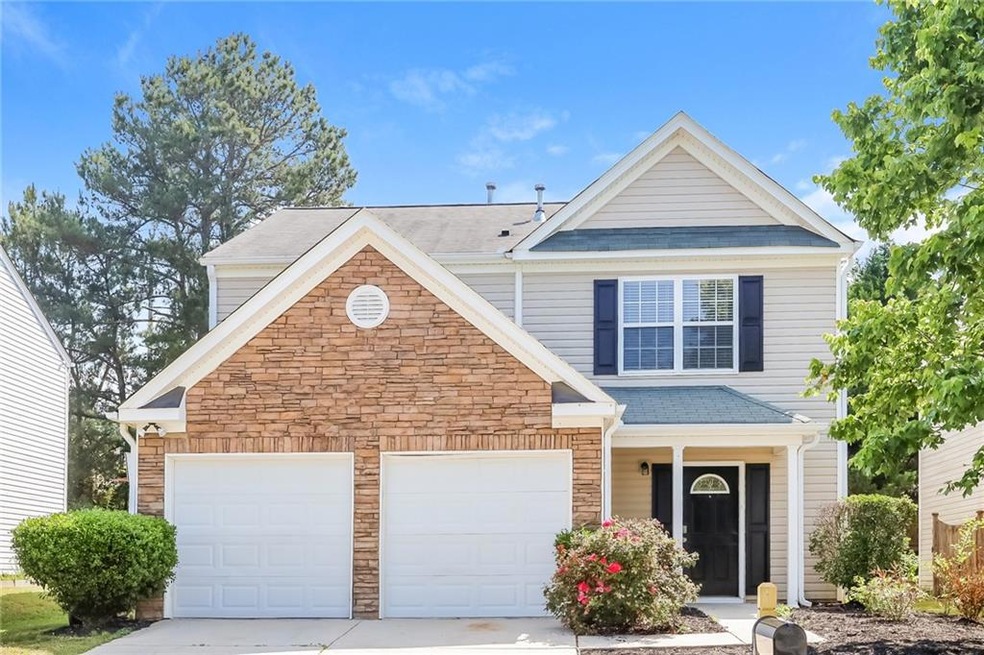
Like all our homes, this one features: a great location in a desirable neighborhood, a comfortable layout with good-sized bedrooms and bathrooms, a great kitchen with plenty of counter and cabinet space, many updated and upgraded features, central HVAC and programmable thermostat, garage and a spacious yard, and it's pet friendly.
Last Agent to Rent the Property
Tanika Tanika Ford
Progress Residential Property Manager, LLC. License #334101 Listed on: 08/04/2023
| Date | Buyer | Sale Price | Title Company |
|---|---|---|---|
| Penn Brilynn Chanell | -- | -- | |
| Penn Belinda | $147,700 | -- |
| Date | Status | Borrower | Loan Amount |
|---|---|---|---|
| Previous Owner | Penn Belinda | $140,267 |
| Date | Event | Price | List to Sale | Price per Sq Ft | Prior Sale |
|---|---|---|---|---|---|
| 08/09/2023 08/09/23 | Rented | $2,095 | 0.0% | -- | |
| 08/04/2023 08/04/23 | For Rent | $2,095 | 0.0% | -- | |
| 04/15/2022 04/15/22 | Sold | $309,000 | +4.4% | $167 / Sq Ft | View Prior Sale |
| 04/01/2022 04/01/22 | Pending | -- | -- | -- | |
| 03/31/2022 03/31/22 | For Sale | $295,900 | 0.0% | $160 / Sq Ft | |
| 03/28/2022 03/28/22 | Pending | -- | -- | -- | |
| 03/25/2022 03/25/22 | For Sale | $295,900 | -- | $160 / Sq Ft |
| Year | Tax Paid | Tax Assessment Tax Assessment Total Assessment is a certain percentage of the fair market value that is determined by local assessors to be the total taxable value of land and additions on the property. | Land | Improvement |
|---|---|---|---|---|
| 2024 | $3,303 | $121,080 | $24,960 | $96,120 |
| 2023 | $3,303 | $121,080 | $24,960 | $96,120 |
| 2022 | $3,179 | $95,640 | $21,280 | $74,360 |
| 2021 | $2,092 | $62,160 | $12,120 | $50,040 |
| 2020 | $2,117 | $62,160 | $12,120 | $50,040 |
| 2019 | $1,937 | $60,760 | $12,120 | $48,640 |
| 2018 | $1,659 | $51,520 | $10,640 | $40,880 |
| 2017 | $1,537 | $46,680 | $10,640 | $36,040 |
| 2016 | $1,374 | $44,160 | $10,520 | $33,640 |
| 2015 | $1,196 | $37,960 | $9,280 | $28,680 |
| 2014 | $985 | $31,000 | $8,160 | $22,840 |
| 2013 | -- | $30,320 | $8,040 | $22,280 |
T
Landlord's Agent in 2023
Tanika Tanika Ford
Progress Residential Property Manager, LLC.

Tenant's Agent in 2023
Shatima Tankson
1028 West
(404) 809-6350
2 in this area
14 Total Sales
R
Seller's Agent in 2022
Roseita Mason
HomeSmart
Buyer's Agent in 2022
WILL WIARD
The Shop Real Estate Co.
(727) 692-0628
1 in this area
3,673 Total Sales
Source: First Multiple Listing Service (FMLS)
MLS Number: 7256950
APN: 8182-06-2-0-016
Disclaimer: Certain information contained herein is derived from information provided by parties other than Homes.com. All information provided is deemed reliable, but is not guaranteed to be accurate and should be independently verified.
![]() Listings identified with the FMLS IDX logo come from FMLS and are held by brokerage firms other than the owner of this website. The listing brokerage is identified in any listing details. Information is deemed reliable but is not guaranteed. If you believe any FMLS listing contains material that infringes your copyrighted work please visit www.fmls.com/dmca to review our DMCA policy and learn how to submit a takedown request. © 2025 First Multiple Listing Service, Inc.
Listings identified with the FMLS IDX logo come from FMLS and are held by brokerage firms other than the owner of this website. The listing brokerage is identified in any listing details. Information is deemed reliable but is not guaranteed. If you believe any FMLS listing contains material that infringes your copyrighted work please visit www.fmls.com/dmca to review our DMCA policy and learn how to submit a takedown request. © 2025 First Multiple Listing Service, Inc.