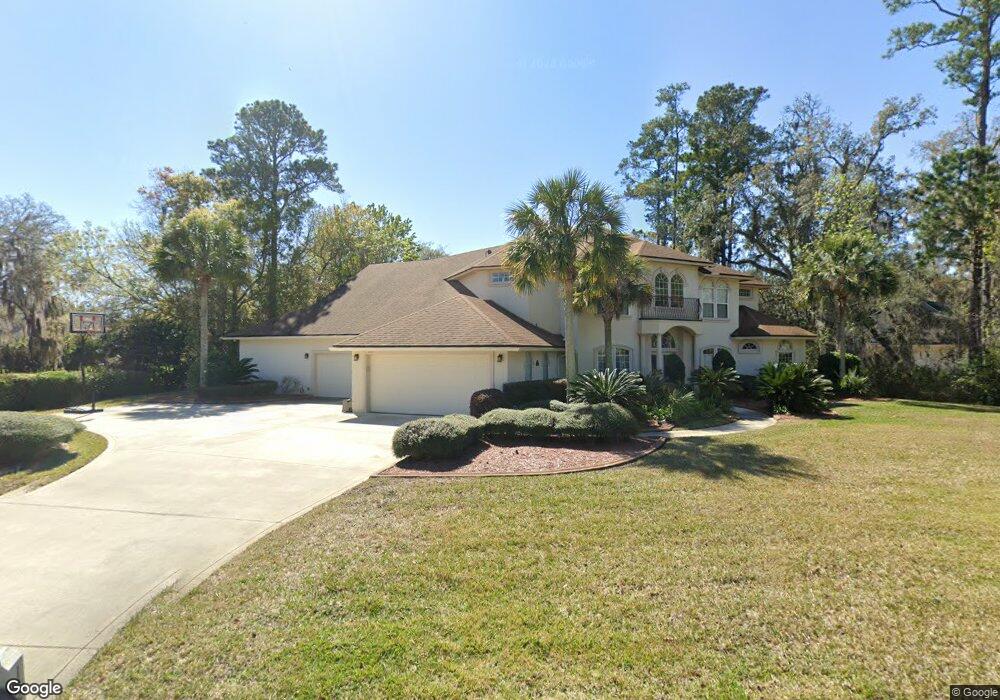
1239 Salt Marsh Ln Fleming Island, FL 32003
Estimated Value: $1,029,151 - $1,150,000
4
Beds
3
Baths
4,500
Sq Ft
$243/Sq Ft
Est. Value
About This Home
This home is located at 1239 Salt Marsh Ln, Fleming Island, FL 32003 and is currently estimated at $1,093,538, approximately $243 per square foot. 1239 Salt Marsh Ln is a home located in Clay County with nearby schools including Fleming Island Elementary School, Fleming Island High School, and Lakeside Junior High School.
Ownership History
Date
Name
Owned For
Owner Type
Purchase Details
Closed on
Feb 6, 2002
Sold by
J A Long Inc
Bought by
Ivory Edward L and Ivory Cynthia
Current Estimated Value
Home Financials for this Owner
Home Financials are based on the most recent Mortgage that was taken out on this home.
Original Mortgage
$619,110
Outstanding Balance
$280,084
Interest Rate
7.12%
Mortgage Type
Small Business Administration
Estimated Equity
$813,454
Create a Home Valuation Report for This Property
The Home Valuation Report is an in-depth analysis detailing your home's value as well as a comparison with similar homes in the area
Home Values in the Area
Average Home Value in this Area
Purchase History
| Date | Buyer | Sale Price | Title Company |
|---|---|---|---|
| Ivory Edward L | $99,900 | -- | |
| J A Long Inc | $93,400 | -- |
Source: Public Records
Mortgage History
| Date | Status | Borrower | Loan Amount |
|---|---|---|---|
| Open | Ivory Edward L | $619,110 |
Source: Public Records
Tax History Compared to Growth
Tax History
| Year | Tax Paid | Tax Assessment Tax Assessment Total Assessment is a certain percentage of the fair market value that is determined by local assessors to be the total taxable value of land and additions on the property. | Land | Improvement |
|---|---|---|---|---|
| 2025 | $8,670 | $634,981 | -- | -- |
| 2024 | $9,574 | $617,086 | -- | -- |
| 2023 | $9,574 | $599,113 | $0 | $0 |
| 2022 | $9,137 | $581,664 | $0 | $0 |
| 2021 | $9,096 | $564,723 | $0 | $0 |
| 2020 | $8,789 | $556,927 | $0 | $0 |
| 2019 | $8,687 | $544,406 | $0 | $0 |
| 2018 | $8,082 | $534,255 | $0 | $0 |
| 2017 | $8,058 | $523,266 | $0 | $0 |
| 2016 | $7,911 | $512,503 | $0 | $0 |
| 2015 | $9,469 | $508,940 | $0 | $0 |
| 2014 | $9,499 | $504,901 | $0 | $0 |
Source: Public Records
Map
Nearby Homes
- 1486 Walnut Creek Dr
- 1576 Sandy Springs Dr
- 1420 Green Turtle Ct
- 1333 S Shore Dr
- 1571 Shelter Cove Dr
- 1860 Royal Fern Ln Unit 9
- 1815 Royal Fern Ln
- 1704 Hunters Ridge Rd
- 1766 Buttonbush Way
- 1912 Bluebonnet Way
- 1940 Bluebonnet Way
- 1853 Inlet Cove Ct
- 1655 Highland View Ct
- 1452 Water Pipit Ln
- 1868 Commodore Point Dr
- 1845 Bluebonnet Way
- 1592 Lakeway Dr
- 2216 Salt Myrtle Ln
- 1576 Linkside Dr
- 1947 Rose Mallow Ln
- 1327 Oaklanding Ln
- 1384 Holmes Landing Dr
- 1319 Oaklanding Ln
- 1380 Holmes Landing Dr
- 1388 Holmes Landing Dr
- 1392 Holmes Landing Dr
- 1376 Holmes Landing Dr
- 1326 Oaklanding Ln
- 1331 Oaklanding Ln
- 1315 Oaklanding Ln
- 1396 Holmes Landing Dr
- 1478 Walnut Creek Dr
- 1316 Oaklanding Ln
- 1482 Walnut Creek Dr
- 1372 Holmes Landing Dr
- 1385 Holmes Landing Dr
- 1381 Holmes Landing Dr
- 1400 Holmes Landing Dr
- 1375 Holmes Landing Dr
- 1391 Holmes Landing Dr