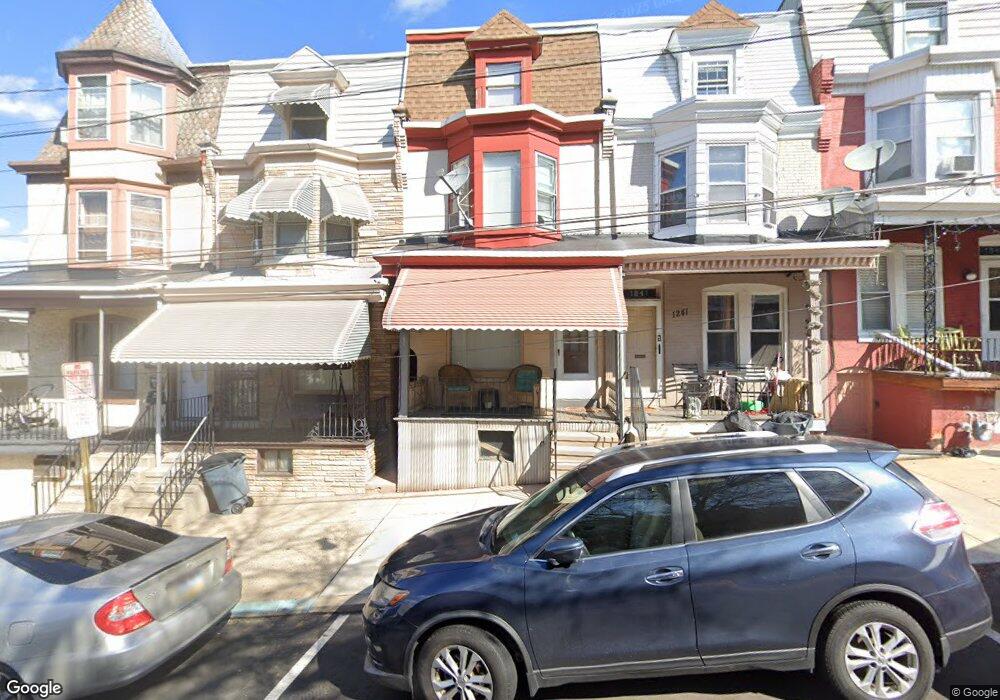
1239 Spring St Reading, PA 19604
Northeast Reading NeighborhoodEstimated Value: $149,730 - $164,000
5
Beds
1
Bath
1,566
Sq Ft
$99/Sq Ft
Est. Value
About This Home
This home is located at 1239 Spring St, Reading, PA 19604 and is currently estimated at $155,433, approximately $99 per square foot. 1239 Spring St is a home located in Berks County with nearby schools including Thirteenth & Union Elementary School, Northeast Middle School, and Reading Senior High School.
Ownership History
Date
Name
Owned For
Owner Type
Purchase Details
Closed on
Jul 26, 2023
Sold by
Miller Paul E
Bought by
Duncan Michelle D and Levan Kimberly A
Current Estimated Value
Home Financials for this Owner
Home Financials are based on the most recent Mortgage that was taken out on this home.
Original Mortgage
$114,880
Outstanding Balance
$112,203
Interest Rate
6.69%
Mortgage Type
FHA
Estimated Equity
$43,230
Purchase Details
Closed on
Nov 22, 2004
Sold by
M&T Bank
Bought by
Kortuem Matthew
Home Financials for this Owner
Home Financials are based on the most recent Mortgage that was taken out on this home.
Original Mortgage
$22,500
Interest Rate
5.81%
Mortgage Type
Fannie Mae Freddie Mac
Purchase Details
Closed on
Jul 21, 2004
Sold by
Medina Zulma
Bought by
M&T Bank
Create a Home Valuation Report for This Property
The Home Valuation Report is an in-depth analysis detailing your home's value as well as a comparison with similar homes in the area
Home Values in the Area
Average Home Value in this Area
Purchase History
| Date | Buyer | Sale Price | Title Company |
|---|---|---|---|
| Duncan Michelle D | $117,000 | Conestoga Title | |
| Kortuem Matthew | $25,000 | -- | |
| M&T Bank | $2,500 | -- |
Source: Public Records
Mortgage History
| Date | Status | Borrower | Loan Amount |
|---|---|---|---|
| Open | Duncan Michelle D | $114,880 | |
| Previous Owner | Kortuem Matthew | $22,500 |
Source: Public Records
Tax History
| Year | Tax Paid | Tax Assessment Tax Assessment Total Assessment is a certain percentage of the fair market value that is determined by local assessors to be the total taxable value of land and additions on the property. | Land | Improvement |
|---|---|---|---|---|
| 2025 | $1,197 | $44,100 | $15,000 | $29,100 |
| 2024 | $1,958 | $44,100 | $15,000 | $29,100 |
| 2023 | $1,928 | $44,100 | $15,000 | $29,100 |
| 2022 | $1,928 | $44,100 | $15,000 | $29,100 |
| 2021 | $1,928 | $44,100 | $15,000 | $29,100 |
| 2020 | $1,908 | $44,100 | $15,000 | $29,100 |
| 2019 | $1,908 | $44,100 | $15,000 | $29,100 |
| 2018 | $1,908 | $44,100 | $15,000 | $29,100 |
| 2017 | $1,896 | $44,100 | $15,000 | $29,100 |
| 2016 | $1,083 | $44,100 | $15,000 | $29,100 |
| 2015 | $1,083 | $44,100 | $15,000 | $29,100 |
| 2014 | $997 | $44,100 | $15,000 | $29,100 |
Source: Public Records
Map
Nearby Homes
Your Personal Tour Guide
Ask me questions while you tour the home.