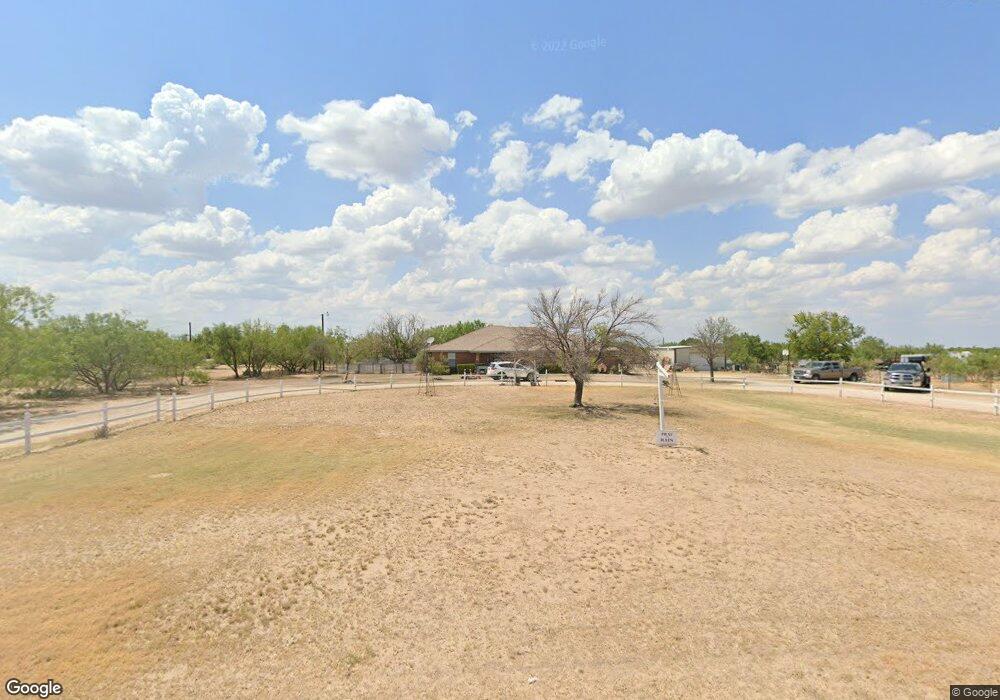
12394 Twin Lakes Ln San Angelo, TX 76904
Estimated Value: $401,508 - $599,000
--
Bed
--
Bath
1,802
Sq Ft
$274/Sq Ft
Est. Value
About This Home
This home is located at 12394 Twin Lakes Ln, San Angelo, TX 76904 and is currently estimated at $494,377, approximately $274 per square foot. 12394 Twin Lakes Ln is a home located in Tom Green County with nearby schools including Christoval Elementary School and Christoval High School.
Ownership History
Date
Name
Owned For
Owner Type
Purchase Details
Closed on
Jan 17, 2008
Sold by
Christman Lisa A and Christman Dennis R
Bought by
Floyd Jerry T and Floyd Judith A
Current Estimated Value
Purchase Details
Closed on
Apr 23, 2007
Sold by
Christman Lisa A
Bought by
Floyd Jerry T and Floyd Judith A
Purchase Details
Closed on
Aug 24, 1998
Sold by
Vann Gary W
Bought by
Floyd Jerry T and Floyd Judith A
Purchase Details
Closed on
Jun 29, 1995
Sold by
Hatchett Jimmie Earl and Rose Ann
Bought by
Floyd Jerry T and Floyd Judith A
Purchase Details
Closed on
Apr 27, 1992
Sold by
Blanek Harry J - Owner
Bought by
Floyd Jerry T and Floyd Judith A
Purchase Details
Closed on
Sep 7, 1990
Sold by
Dove Creek Development Co (Owner)
Bought by
Floyd Jerry T and Floyd Judith A
Purchase Details
Closed on
Sep 5, 1990
Sold by
Dove Creek Development Co (Owner)
Bought by
Floyd Jerry T and Floyd Judith A
Create a Home Valuation Report for This Property
The Home Valuation Report is an in-depth analysis detailing your home's value as well as a comparison with similar homes in the area
Home Values in the Area
Average Home Value in this Area
Purchase History
| Date | Buyer | Sale Price | Title Company |
|---|---|---|---|
| Floyd Jerry T | -- | -- | |
| Floyd Jerry T | -- | -- | |
| Floyd Jerry T | -- | -- | |
| Floyd Jerry T | -- | -- | |
| Floyd Jerry T | -- | -- | |
| Floyd Jerry T | -- | -- | |
| Floyd Jerry T | -- | -- |
Source: Public Records
Tax History Compared to Growth
Tax History
| Year | Tax Paid | Tax Assessment Tax Assessment Total Assessment is a certain percentage of the fair market value that is determined by local assessors to be the total taxable value of land and additions on the property. | Land | Improvement |
|---|---|---|---|---|
| 2025 | $2,757 | $384,490 | $123,420 | $261,070 |
| 2024 | $2,079 | $331,640 | $123,420 | $208,220 |
| 2023 | $1,809 | $374,820 | $139,390 | $235,430 |
| 2022 | $2,709 | $203,810 | $11,380 | $192,430 |
| 2021 | $2,633 | $174,470 | $0 | $0 |
| 2020 | $3,083 | $174,470 | $11,380 | $163,090 |
| 2019 | $3,075 | $174,470 | $11,380 | $163,090 |
| 2018 | $2,888 | $164,820 | $11,380 | $153,440 |
| 2017 | $2,711 | $157,270 | $11,380 | $145,890 |
| 2016 | $2,707 | $157,060 | $11,380 | $145,680 |
| 2015 | $1,926 | $142,810 | $11,380 | $131,430 |
| 2014 | $1,686 | $138,470 | $7,000 | $131,470 |
| 2013 | $1,531 | $127,500 | $0 | $0 |
Source: Public Records
Map
Nearby Homes
- 12274 Twin Lakes Ln
- 12846 Dove Creek Ln W
- 12315 Dove Creek Ln W
- 12237 Dove Creek Ln W
- 13526 S Dove Creek Rd
- 13442 S Farm To Market Road 2335
- 13538 Fm 2335
- 12182 Spring Creek Ln
- 13914 S Dove Creek Rd
- 11954 Lagoon Ln
- 10954 Twin Lakes Ln
- 10561 Twin Lakes Ln
- 12183 W Torres Rd
- 9434 Bryant Ln
- 0000 Fm 2166
- 9225 Remuda Ln Unit 64
- 9201 Remuda Ln Unit 62
- 9071 W Fm 2335
- 9213 Remuda Ln
- 16900 Riata Trail Unit 61
- 12393 Twin Lakes Ln
- 12362 Twin Lakes Ln
- 12361 Twin Lakes Ln
- 12441 Twin Lakes Ln
- 12526 Twin Lakes Ln
- 12329 Twin Lakes Ln
- 12314 Twin Lakes Ln
- 12409 Twin Lakes Ln
- 12293 Twin Lakes Ln
- 12261 Twin Lakes Ln
- 12469 Twin Lakes Ln
- 12218 Dove Creek Ln E
- 12229 Twin Lakes Ln
- 12457 Twin Lakes Ln
- 12380 Pecan Ln
- 12194 Twin Lakes Ln
- 12193 Twin Lakes Ln
- 12130 Twin Lakes Ln
- 12509 Twin Lakes Ln
- 12186 Pecan Ln