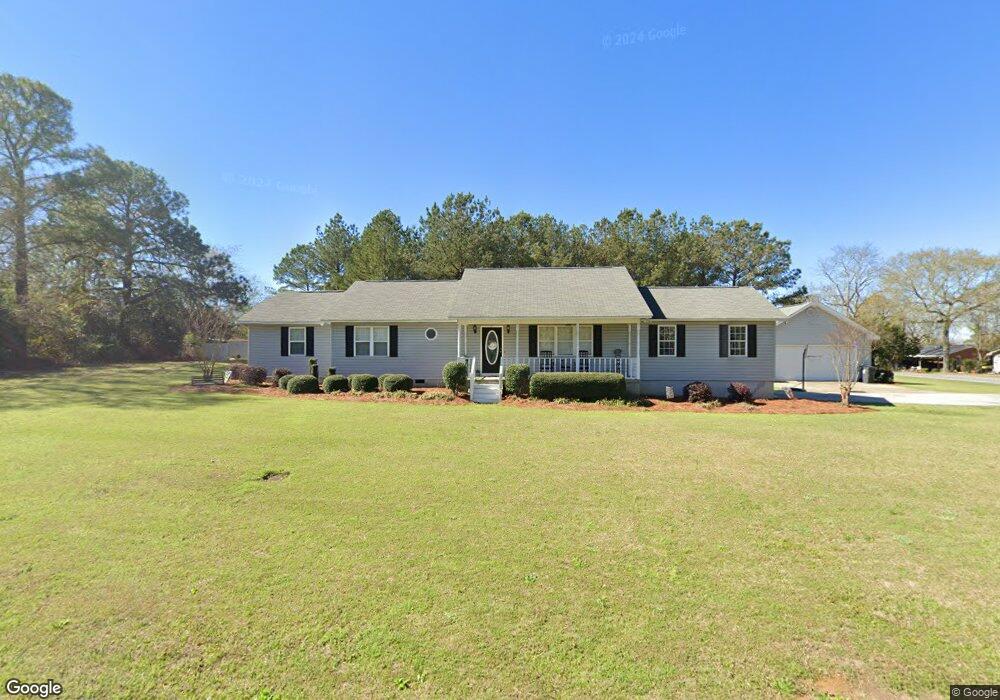
124 10th St Cochran, GA 31014
Estimated Value: $204,000 - $215,000
2
Beds
2
Baths
1,526
Sq Ft
$136/Sq Ft
Est. Value
About This Home
This home is located at 124 10th St, Cochran, GA 31014 and is currently estimated at $208,255, approximately $136 per square foot. 124 10th St is a home located in Bleckley County with nearby schools including Bleckley County Primary School, Bleckley County Elementary School, and Bleckley Middle School.
Ownership History
Date
Name
Owned For
Owner Type
Purchase Details
Closed on
Sep 12, 2017
Sold by
Rycroft Tracy L
Bought by
Moore Timothy C and Moore Wendy P
Current Estimated Value
Home Financials for this Owner
Home Financials are based on the most recent Mortgage that was taken out on this home.
Original Mortgage
$136,363
Outstanding Balance
$113,295
Interest Rate
3.89%
Mortgage Type
New Conventional
Estimated Equity
$94,960
Purchase Details
Closed on
Sep 16, 2005
Sold by
Heath Candace M
Bought by
Rycroft Tracy L
Home Financials for this Owner
Home Financials are based on the most recent Mortgage that was taken out on this home.
Original Mortgage
$85,263
Interest Rate
5.77%
Mortgage Type
New Conventional
Purchase Details
Closed on
Mar 11, 2004
Sold by
Bohannon Chad M
Bought by
Rycroft Tracy L
Purchase Details
Closed on
Jan 24, 1997
Sold by
Bohannon Mitchell
Bought by
Bohannon Chad M
Purchase Details
Closed on
Jun 13, 1959
Bought by
Bohannon Mitchell
Create a Home Valuation Report for This Property
The Home Valuation Report is an in-depth analysis detailing your home's value as well as a comparison with similar homes in the area
Home Values in the Area
Average Home Value in this Area
Purchase History
| Date | Buyer | Sale Price | Title Company |
|---|---|---|---|
| Moore Timothy C | $135,000 | -- | |
| Rycroft Tracy L | -- | -- | |
| Rycroft Tracy L | $80,000 | -- | |
| Bohannon Chad M | $2,000 | -- | |
| Bohannon Mitchell | -- | -- |
Source: Public Records
Mortgage History
| Date | Status | Borrower | Loan Amount |
|---|---|---|---|
| Open | Moore Timothy C | $136,363 | |
| Previous Owner | Rycroft Tracy L | $85,263 |
Source: Public Records
Tax History
| Year | Tax Paid | Tax Assessment Tax Assessment Total Assessment is a certain percentage of the fair market value that is determined by local assessors to be the total taxable value of land and additions on the property. | Land | Improvement |
|---|---|---|---|---|
| 2025 | $2,736 | $73,224 | $4,800 | $68,424 |
| 2024 | $2,759 | $73,224 | $4,800 | $68,424 |
| 2023 | $3,026 | $74,064 | $4,800 | $69,264 |
| 2022 | $1,842 | $67,704 | $4,800 | $62,904 |
| 2021 | $1,591 | $56,024 | $4,800 | $51,224 |
| 2020 | $1,598 | $56,024 | $4,800 | $51,224 |
| 2019 | $1,330 | $46,636 | $3,200 | $43,436 |
| 2018 | $1,886 | $46,636 | $3,200 | $43,436 |
| 2017 | $1,289 | $46,636 | $3,200 | $43,436 |
| 2016 | $1,302 | $46,636 | $3,200 | $43,436 |
| 2015 | -- | $46,636 | $3,200 | $43,436 |
| 2014 | -- | $46,636 | $3,200 | $43,436 |
| 2013 | -- | $41,480 | $3,200 | $38,280 |
Source: Public Records
Map
Nearby Homes
- 216 E Peter St
- 260 Ann St
- 264 Ann St
- 113 Taylor Dr
- 132 Mcvay Dr
- 188 E Lewis St
- 173 Berkley Rd
- 7 Evergreen Dr
- 0 Tiffany Dr Unit 10664262
- 104 S 4th St
- 161 E Cherry St
- 288 Frank Cook Rd
- 116 W Lewis St
- 175 Wood Oak Cir
- 0 Wood Oak Cir Unit 233873
- 0 Wood Oak Cir Unit 9278951
- 238 Wood Oak Cir
- 1277 Georgia 112
- 134 Easy St
- 0 Willow Creek Run
Your Personal Tour Guide
Ask me questions while you tour the home.