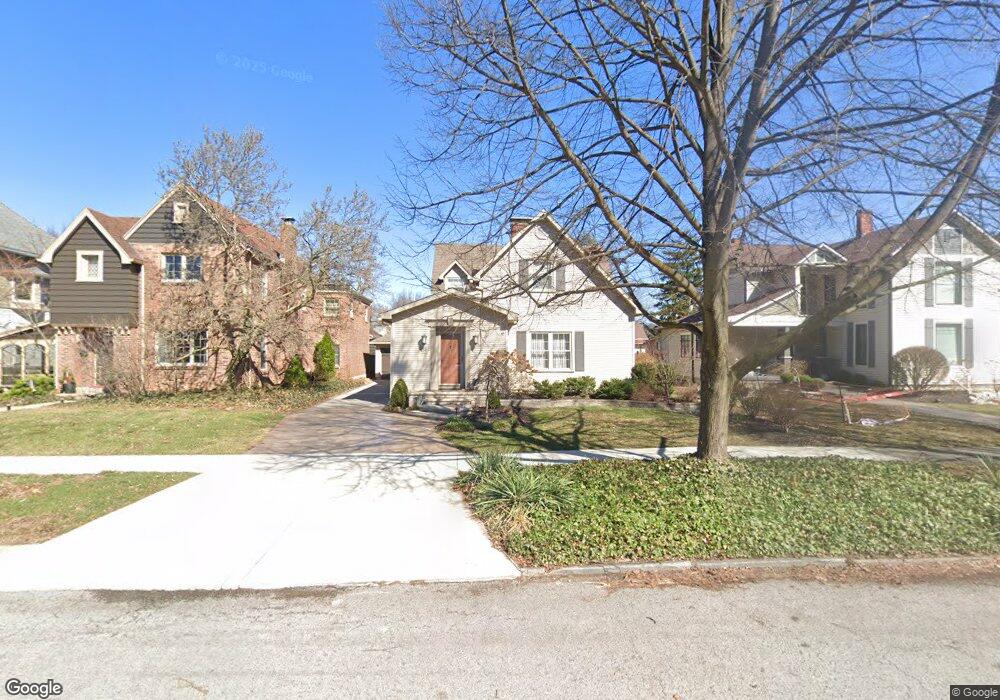
124 2nd St Findlay, OH 45840
Estimated Value: $255,000 - $287,000
3
Beds
3
Baths
2,021
Sq Ft
$135/Sq Ft
Est. Value
About This Home
This home is located at 124 2nd St, Findlay, OH 45840 and is currently estimated at $273,107, approximately $135 per square foot. 124 2nd St is a home located in Hancock County with nearby schools including Lincoln Elementary School, Donnell Middle School, and Findlay High School.
Create a Home Valuation Report for This Property
The Home Valuation Report is an in-depth analysis detailing your home's value as well as a comparison with similar homes in the area
Home Values in the Area
Average Home Value in this Area
Tax History
| Year | Tax Paid | Tax Assessment Tax Assessment Total Assessment is a certain percentage of the fair market value that is determined by local assessors to be the total taxable value of land and additions on the property. | Land | Improvement |
|---|---|---|---|---|
| 2024 | $2,949 | $83,010 | $6,930 | $76,080 |
| 2023 | $2,953 | $83,010 | $6,930 | $76,080 |
| 2022 | $2,943 | $83,010 | $6,930 | $76,080 |
| 2021 | $2,604 | $63,980 | $6,910 | $57,070 |
| 2020 | $2,604 | $63,980 | $6,910 | $57,070 |
| 2019 | $2,551 | $63,980 | $6,910 | $57,070 |
| 2018 | $2,226 | $51,180 | $5,530 | $45,650 |
| 2017 | $1,113 | $51,180 | $5,530 | $45,650 |
| 2016 | $2,194 | $51,180 | $5,530 | $45,650 |
| 2015 | $2,298 | $52,550 | $5,530 | $47,020 |
| 2014 | $2,298 | $52,550 | $5,530 | $47,020 |
| 2012 | $2,301 | $52,220 | $5,530 | $46,690 |
Source: Public Records
Map
Nearby Homes
- 216 1st St
- 865 S Main St
- 123 Glendale Ave
- 206 Greenlawn Ave
- 829 Maple Ave
- 1304 Douglas Pkwy
- 1113 Hurd Ave
- 423 Elm St
- 412 Lima Ave
- 416 1/2 Lima Ave
- 324 W Mcpherson Ave
- 845 Hurd Ave
- 860 Hurd Ave
- 315 Fairlawn Place
- 731 5th St
- 331 Fairlawn Place
- 514 Liberty St
- 527 W Sandusky St
- 136 E Hobart Ave
- 15591 Canadian Way
Your Personal Tour Guide
Ask me questions while you tour the home.