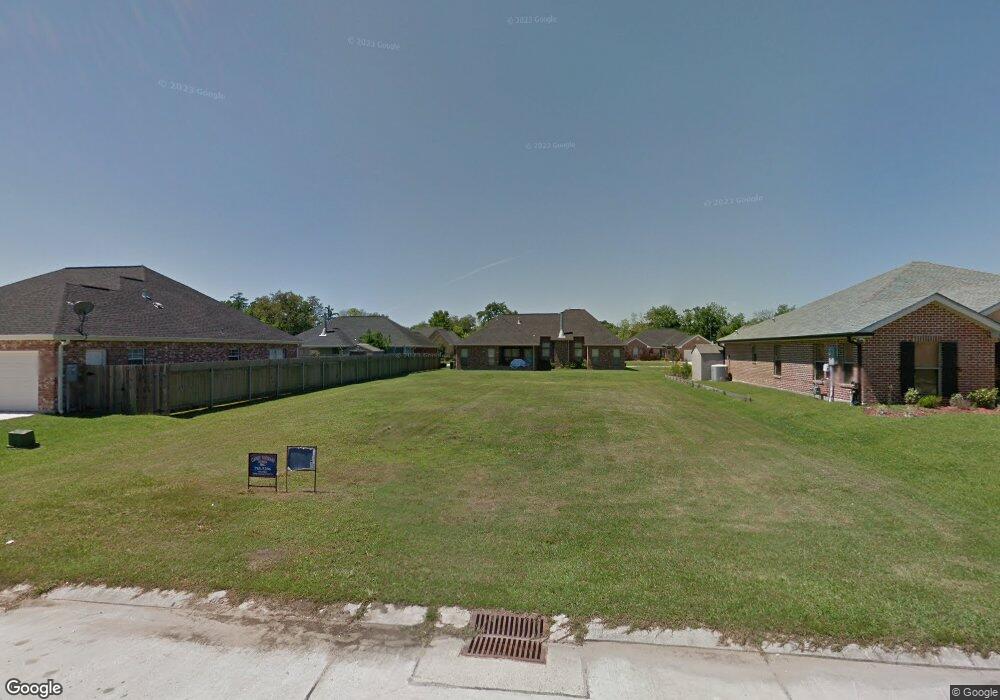
124 Allison Dr Luling, LA 70070
Estimated Value: $342,771 - $370,000
Studio
--
Bath
1,846
Sq Ft
$193/Sq Ft
Est. Value
About This Home
This home is located at 124 Allison Dr, Luling, LA 70070 and is currently estimated at $356,943, approximately $193 per square foot. 124 Allison Dr is a home with nearby schools including Mimosa Park Elementary School, Lakewood Elementary School, and J.B. Martin Middle School.
Ownership History
Date
Name
Owned For
Owner Type
Purchase Details
Closed on
Dec 31, 2012
Sold by
Mancuso Jamie Haydel
Bought by
Caillet Syl F
Current Estimated Value
Home Financials for this Owner
Home Financials are based on the most recent Mortgage that was taken out on this home.
Original Mortgage
$216,000
Outstanding Balance
$147,365
Interest Rate
3.35%
Mortgage Type
New Conventional
Estimated Equity
$209,578
Purchase Details
Closed on
Nov 17, 2010
Sold by
Classic Louisiana Homes Inc
Bought by
Caillet Syl F
Purchase Details
Closed on
Mar 24, 2010
Sold by
Fonseca Clarence B and Fonseca Holly Luttrell
Bought by
Classic Louisiana Homes Inc
Purchase Details
Closed on
Nov 17, 2006
Sold by
Schaffer Glenn
Bought by
Fonseca Clarence B and Fonseca Holly Luttrell
Create a Home Valuation Report for This Property
The Home Valuation Report is an in-depth analysis detailing your home's value as well as a comparison with similar homes in the area
Home Values in the Area
Average Home Value in this Area
Purchase History
| Date | Buyer | Sale Price | Title Company |
|---|---|---|---|
| Caillet Syl F | $240,000 | Choice Title | |
| Caillet Syl F | $51,750 | None Available | |
| Classic Louisiana Homes Inc | $50,000 | Grescent Title Llc | |
| Fonseca Clarence B | $61,500 | None Available |
Source: Public Records
Mortgage History
| Date | Status | Borrower | Loan Amount |
|---|---|---|---|
| Open | Caillet Syl F | $216,000 |
Source: Public Records
Tax History
| Year | Tax Paid | Tax Assessment Tax Assessment Total Assessment is a certain percentage of the fair market value that is determined by local assessors to be the total taxable value of land and additions on the property. | Land | Improvement |
|---|---|---|---|---|
| 2025 | $2,566 | $32,890 | $6,660 | $26,230 |
| 2024 | $2,566 | $32,890 | $6,660 | $26,230 |
| 2023 | $2,606 | $25,015 | $7,110 | $17,905 |
| 2022 | $2,925 | $25,015 | $7,110 | $17,905 |
| 2021 | $2,655 | $22,514 | $6,399 | $16,115 |
| 2020 | $2,956 | $25,015 | $7,110 | $17,905 |
| 2019 | $2,800 | $23,616 | $5,300 | $18,316 |
| 2018 | $2,779 | $23,616 | $5,300 | $18,316 |
| 2017 | $2,776 | $23,616 | $5,300 | $18,316 |
| 2016 | $2,787 | $23,616 | $5,300 | $18,316 |
| 2015 | $1,840 | $23,148 | $5,861 | $17,287 |
| 2014 | $1,773 | $23,148 | $5,861 | $17,287 |
| 2013 | $666 | $5,861 | $5,861 | $0 |
Source: Public Records
Map
Nearby Homes
Your Personal Tour Guide
Ask me questions while you tour the home.