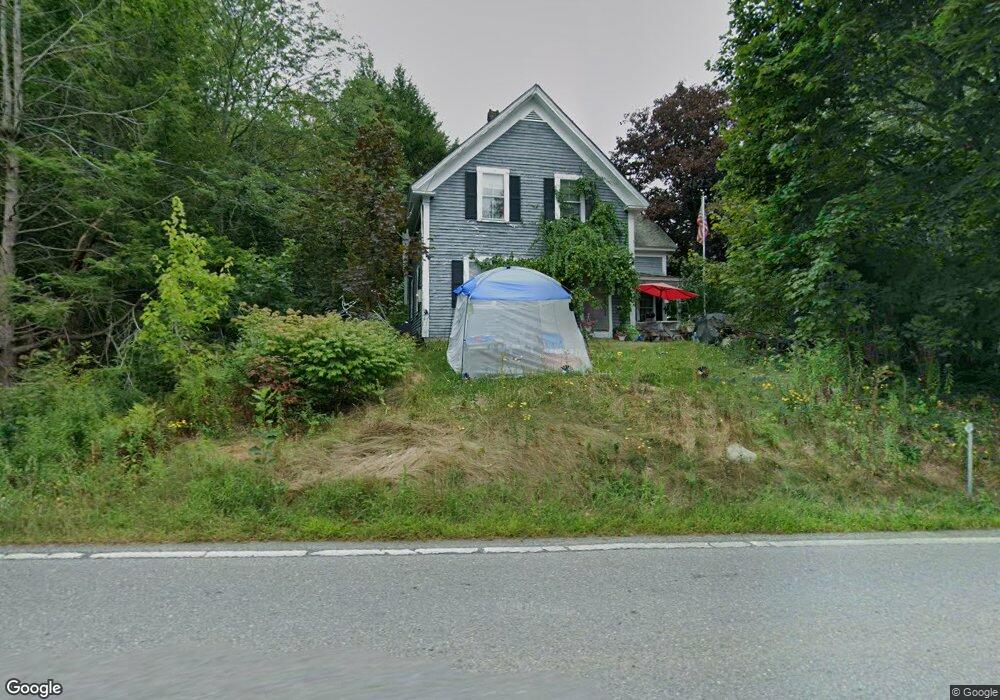
124 Ashby Rd Ashburnham, MA 01430
Estimated Value: $414,000 - $461,000
3
Beds
2
Baths
1,562
Sq Ft
$278/Sq Ft
Est. Value
About This Home
This home is located at 124 Ashby Rd, Ashburnham, MA 01430 and is currently estimated at $433,711, approximately $277 per square foot. 124 Ashby Rd is a home located in Worcester County with nearby schools including Oakmont Regional High School and Cushing Academy.
Ownership History
Date
Name
Owned For
Owner Type
Purchase Details
Closed on
Jul 31, 2006
Sold by
Ehmann Anna Mae and Ehmann Evan D
Bought by
Smith Cheryl A
Current Estimated Value
Home Financials for this Owner
Home Financials are based on the most recent Mortgage that was taken out on this home.
Original Mortgage
$200,000
Outstanding Balance
$117,611
Interest Rate
6.67%
Mortgage Type
Purchase Money Mortgage
Estimated Equity
$316,100
Purchase Details
Closed on
Aug 14, 1995
Sold by
Sedwick Kimberlee D
Bought by
Ehmann Evan D and Ehmann Anna Mae
Home Financials for this Owner
Home Financials are based on the most recent Mortgage that was taken out on this home.
Original Mortgage
$90,000
Interest Rate
7.48%
Mortgage Type
Purchase Money Mortgage
Create a Home Valuation Report for This Property
The Home Valuation Report is an in-depth analysis detailing your home's value as well as a comparison with similar homes in the area
Home Values in the Area
Average Home Value in this Area
Purchase History
| Date | Buyer | Sale Price | Title Company |
|---|---|---|---|
| Smith Cheryl A | $250,000 | -- | |
| Smith Cheryl A | $250,000 | -- | |
| Ehmann Evan D | $130,000 | -- | |
| Ehmann Evan D | $130,000 | -- |
Source: Public Records
Mortgage History
| Date | Status | Borrower | Loan Amount |
|---|---|---|---|
| Open | Smith Cheryl A | $200,000 | |
| Closed | Ehmann Evan D | $200,000 | |
| Previous Owner | Ehmann Evan D | $115,000 | |
| Previous Owner | Ehmann Evan D | $90,000 |
Source: Public Records
Tax History
| Year | Tax Paid | Tax Assessment Tax Assessment Total Assessment is a certain percentage of the fair market value that is determined by local assessors to be the total taxable value of land and additions on the property. | Land | Improvement |
|---|---|---|---|---|
| 2025 | $4,996 | $336,000 | $51,500 | $284,500 |
| 2024 | $4,867 | $309,000 | $51,300 | $257,700 |
| 2023 | $4,349 | $262,800 | $51,300 | $211,500 |
| 2022 | $4,750 | $251,600 | $47,400 | $204,200 |
| 2021 | $4,591 | $223,400 | $47,400 | $176,000 |
| 2020 | $4,490 | $223,400 | $47,400 | $176,000 |
| 2019 | $9 | $204,400 | $47,400 | $157,000 |
| 2018 | $1,518 | $201,000 | $44,900 | $156,100 |
| 2017 | $4,461 | $194,200 | $41,800 | $152,400 |
| 2016 | $4,334 | $190,500 | $41,200 | $149,300 |
Source: Public Records
Map
Nearby Homes
- 152 Ashby Rd
- 57 Ashby Rd
- 100 Main St
- 14 Central St
- Lot 3 W State Rd
- 9 Willard Rd
- 18 Corey Hill Rd
- 0 Rindge Turnpike
- 36 Hillandale Rd
- 75 Willard Rd
- 38 Hemlock Rd
- 151 Wilker Rd
- 44 Rindge State Rd
- Lot 40C Winchendon Rd
- 2409 W State Rd
- 6 Wyman Rd
- 26 Wellington Rd
- 162 Sherbert Rd
- 5 Russell Ave
- 72 Park Rd
Your Personal Tour Guide
Ask me questions while you tour the home.