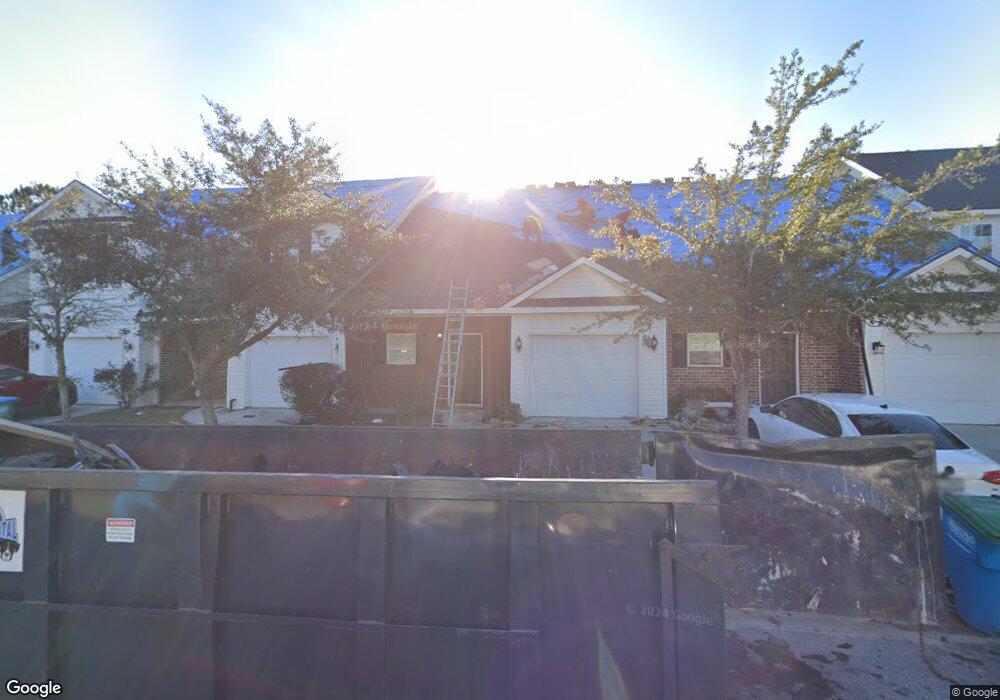
124 Barfield Way Unit 9 Rincon, GA 31326
Estimated Value: $230,000 - $271,000
3
Beds
3
Baths
1,400
Sq Ft
$180/Sq Ft
Est. Value
About This Home
This home is located at 124 Barfield Way Unit 9, Rincon, GA 31326 and is currently estimated at $252,399, approximately $180 per square foot. 124 Barfield Way Unit 9 is a home located in Effingham County with nearby schools including Blandford Elementary School, Ebenezer Middle School, and Effingham County High School.
Ownership History
Date
Name
Owned For
Owner Type
Purchase Details
Closed on
Sep 29, 2015
Sold by
Wbe Supply Inc
Bought by
Anderson Susan G
Current Estimated Value
Home Financials for this Owner
Home Financials are based on the most recent Mortgage that was taken out on this home.
Original Mortgage
$49,000
Outstanding Balance
$38,301
Interest Rate
3.93%
Mortgage Type
New Conventional
Estimated Equity
$214,098
Purchase Details
Closed on
Mar 28, 2011
Sold by
Federal Home Loan Mortgage Corporation
Bought by
Wbe Supply Inc
Home Financials for this Owner
Home Financials are based on the most recent Mortgage that was taken out on this home.
Original Mortgage
$57,235
Interest Rate
4.92%
Mortgage Type
Credit Line Revolving
Purchase Details
Closed on
Jan 4, 2011
Sold by
Citimortgage Inc
Bought by
Federal Home Loan Mortgage Corp
Purchase Details
Closed on
Mar 30, 2007
Sold by
Anderson Danny E
Bought by
Waters Andrew W
Home Financials for this Owner
Home Financials are based on the most recent Mortgage that was taken out on this home.
Original Mortgage
$128,000
Interest Rate
6.15%
Mortgage Type
New Conventional
Create a Home Valuation Report for This Property
The Home Valuation Report is an in-depth analysis detailing your home's value as well as a comparison with similar homes in the area
Home Values in the Area
Average Home Value in this Area
Purchase History
| Date | Buyer | Sale Price | Title Company |
|---|---|---|---|
| Anderson Susan G | -- | -- | |
| Wbe Supply Inc | $57,000 | -- | |
| Federal Home Loan Mortgage Corp | -- | -- | |
| Citimortgage Inc | $106,897 | -- | |
| Waters Andrew W | -- | -- |
Source: Public Records
Mortgage History
| Date | Status | Borrower | Loan Amount |
|---|---|---|---|
| Open | Anderson Susan G | $49,000 | |
| Previous Owner | Wbe Supply Inc | $57,235 | |
| Previous Owner | Waters Andrew W | $128,000 |
Source: Public Records
Tax History Compared to Growth
Tax History
| Year | Tax Paid | Tax Assessment Tax Assessment Total Assessment is a certain percentage of the fair market value that is determined by local assessors to be the total taxable value of land and additions on the property. | Land | Improvement |
|---|---|---|---|---|
| 2025 | $2,422 | $95,835 | $13,000 | $82,835 |
| 2024 | $2,422 | $90,898 | $13,000 | $77,898 |
| 2023 | $1,778 | $72,923 | $13,000 | $59,923 |
| 2022 | $1,617 | $61,400 | $13,000 | $48,400 |
| 2021 | $1,478 | $55,253 | $9,400 | $45,853 |
| 2020 | $1,462 | $50,206 | $7,400 | $42,806 |
| 2019 | $1,439 | $50,206 | $7,400 | $42,806 |
| 2018 | $1,150 | $41,168 | $4,800 | $36,368 |
| 2017 | $1,437 | $50,669 | $6,000 | $44,669 |
| 2016 | $989 | $34,545 | $8,000 | $26,545 |
| 2015 | -- | $28,105 | $1,560 | $26,545 |
| 2014 | -- | $27,745 | $1,200 | $26,545 |
| 2013 | -- | $45,441 | $1,200 | $44,241 |
Source: Public Records
Map
Nearby Homes
- 301 Pebble Dr
- 419 Flint Dr
- 124 Tolliver Ln
- 107 Stonewalk Dr
- 114 Stonewalk Dr
- 114 Reese Way
- 216 Market St
- 221 Jasper Ln
- 156 Stonewalk Dr
- 233 Jasper Ln
- 136 Fraser Ln
- 235 Saint Andrews Rd
- 601 Heathcliff Ct
- 105 Saint Andrews Rd
- 518 Westminster Ct
- 267 Jasper Ln
- 415 Seabreeze Dr
- 417 Keiffer Dr
- 317 St Andrews Rd
- 427 Seabreeze Dr
- 126 Barfield Way Unit 14
- 126 Barfield Way
- 128 Barfield Way Unit 15
- 128 Barfield Way
- 124 Barfield Way
- 130 Barfield Way
- 122 Barfield Way Unit 12
- 122 Barfield Way
- 120 Barfield Way
- 118 Barfield Way
- 123 Barfield Way
- 305 Pebble Dr
- 121 Barfield Way
- 132 Barfield Way
- 307 Pebble Dr
- 116 Barfield Way Unit 9
- 116 Barfield Way
- 0 Barfield Way Unit 79101
- 0 Barfield Way Unit 79099
- 0 Barfield Way Unit 79095