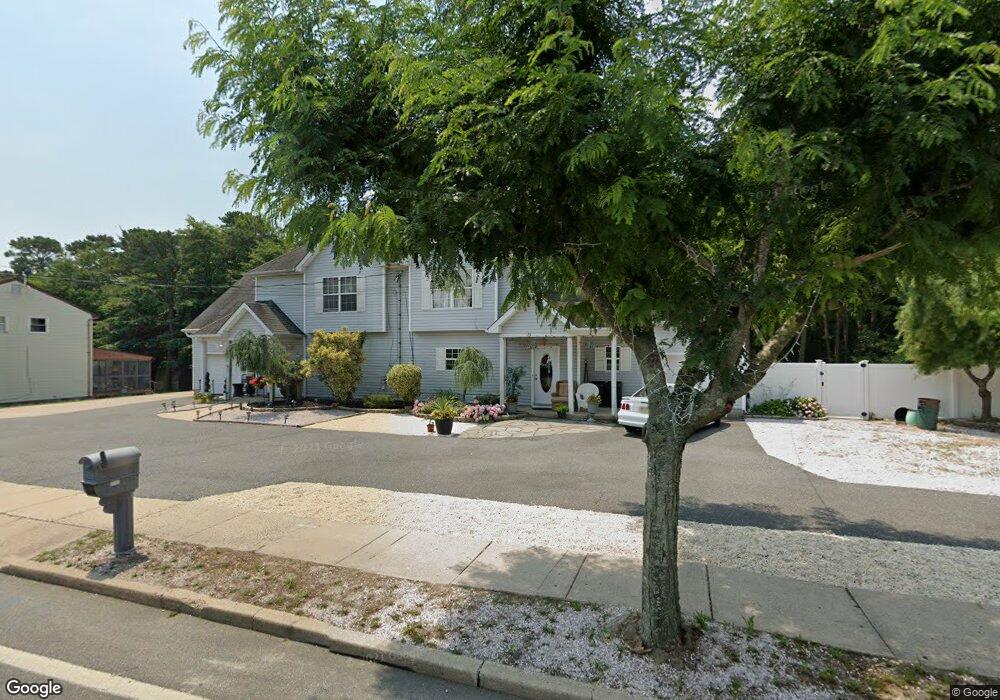
124 Bayshore Dr Barnegat, NJ 08005
Barnegat Township NeighborhoodEstimated Value: $419,000 - $516,000
4
Beds
3
Baths
1,872
Sq Ft
$251/Sq Ft
Est. Value
About This Home
This home is located at 124 Bayshore Dr, Barnegat, NJ 08005 and is currently estimated at $470,602, approximately $251 per square foot. 124 Bayshore Dr is a home located in Ocean County with nearby schools including Barnegat High School.
Ownership History
Date
Name
Owned For
Owner Type
Purchase Details
Closed on
Mar 29, 2019
Sold by
Rodriguez Jose and Rodriguez Madeline
Bought by
Rodriguez Madeline and Rodriguez Jose A
Current Estimated Value
Purchase Details
Closed on
Jul 30, 2008
Sold by
Federal National Mortgage Association
Bought by
Rodriguez Jose and Rodriguez Madeline
Purchase Details
Closed on
Jun 19, 2008
Sold by
Chase Home Finance Llc
Bought by
Federal National Mortgage Association
Purchase Details
Closed on
Oct 8, 2007
Sold by
Cinque Rashele and Hoyt Frances
Bought by
Chase Home Finance Llc
Purchase Details
Closed on
Aug 12, 2003
Sold by
Jon Ran Construction
Bought by
Rashele Cinque and Hoyt Frances
Home Financials for this Owner
Home Financials are based on the most recent Mortgage that was taken out on this home.
Original Mortgage
$152,900
Interest Rate
5.46%
Purchase Details
Closed on
Jul 11, 2003
Sold by
Foxmoor At Bayville
Bought by
Jon Ran Construction
Home Financials for this Owner
Home Financials are based on the most recent Mortgage that was taken out on this home.
Original Mortgage
$152,900
Interest Rate
5.46%
Create a Home Valuation Report for This Property
The Home Valuation Report is an in-depth analysis detailing your home's value as well as a comparison with similar homes in the area
Home Values in the Area
Average Home Value in this Area
Purchase History
| Date | Buyer | Sale Price | Title Company |
|---|---|---|---|
| Rodriguez Madeline | -- | None Available | |
| Rodriguez Jose | $210,000 | None Available | |
| Federal National Mortgage Association | -- | None Available | |
| Chase Home Finance Llc | $257,264 | None Available | |
| Rashele Cinque | $169,900 | -- | |
| Jon Ran Construction | $39,000 | -- |
Source: Public Records
Mortgage History
| Date | Status | Borrower | Loan Amount |
|---|---|---|---|
| Previous Owner | Rashele Cinque | $152,900 |
Source: Public Records
Tax History Compared to Growth
Tax History
| Year | Tax Paid | Tax Assessment Tax Assessment Total Assessment is a certain percentage of the fair market value that is determined by local assessors to be the total taxable value of land and additions on the property. | Land | Improvement |
|---|---|---|---|---|
| 2025 | $6,529 | $219,300 | $71,800 | $147,500 |
| 2024 | $6,384 | $219,300 | $71,800 | $147,500 |
| 2023 | $6,178 | $219,300 | $71,800 | $147,500 |
| 2022 | $6,178 | $219,300 | $71,800 | $147,500 |
| 2021 | $6,147 | $219,300 | $71,800 | $147,500 |
| 2020 | $6,121 | $219,300 | $71,800 | $147,500 |
| 2019 | $6,031 | $219,300 | $71,800 | $147,500 |
| 2018 | $5,985 | $219,300 | $71,800 | $147,500 |
| 2017 | $5,886 | $219,300 | $71,800 | $147,500 |
| 2016 | $5,765 | $219,300 | $71,800 | $147,500 |
| 2015 | $5,583 | $219,300 | $71,800 | $147,500 |
| 2014 | $5,689 | $229,300 | $81,800 | $147,500 |
Source: Public Records
Map
Nearby Homes
- 126 Bayshore Dr
- 128 Bayshore Dr
- 128 Bayshore Dr Unit A
- 128 Bayshore Dr Unit B
- 128 Bay Shore Dr B
- 130 Bayshore Dr
- 132a Bayshore Dr
- 132 Bayshore Dr
- 132 Bayshore Dr Unit B RIGHT SIDE
- 132 Bay Shore Dr Unit A
- 132 Bay Shore Dr
- 6 Teal St
- 6 Teal St Unit A
- 39 E Thorn Ave
- 41 E Thorn Ave
- 37 E Thorn Ave
- 134A Bayshore Dr
- 134B Bayshore Dr Unit B
- 134 Bay Shore Dr
- 134 Bay Shore Dr Unit B