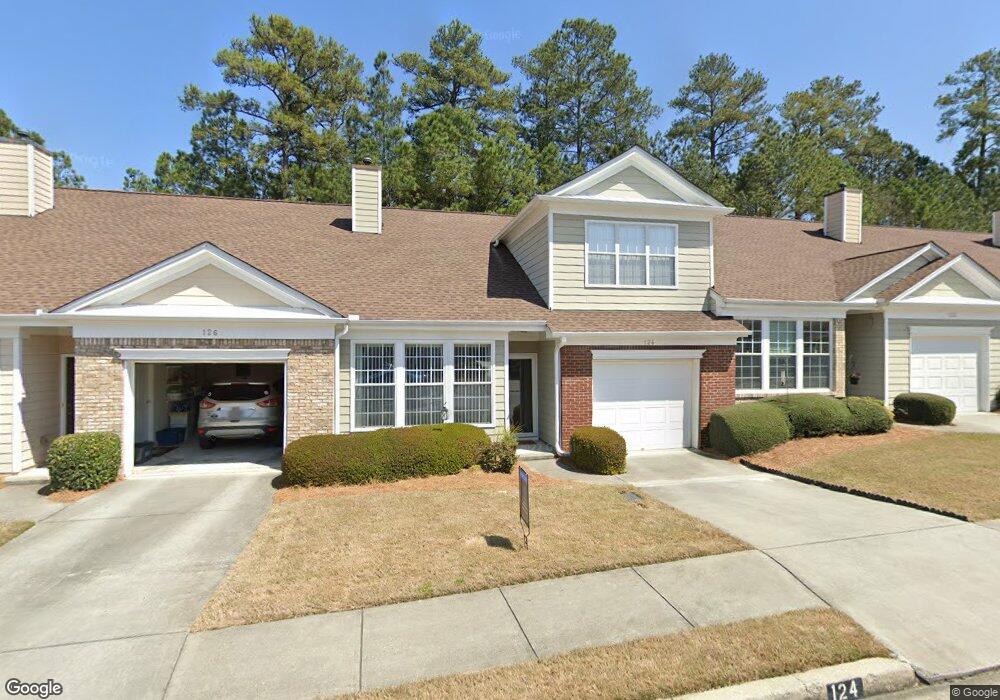
124 Camry Ln SW Grayson, GA 30017
Estimated Value: $272,625 - $281,000
3
Beds
3
Baths
1,310
Sq Ft
$210/Sq Ft
Est. Value
About This Home
This home is located at 124 Camry Ln SW, Grayson, GA 30017 and is currently estimated at $275,406, approximately $210 per square foot. 124 Camry Ln SW is a home located in Gwinnett County with nearby schools including Grayson Elementary School, Bay Creek Middle School, and Grayson High School.
Ownership History
Date
Name
Owned For
Owner Type
Purchase Details
Closed on
May 17, 2022
Sold by
Smith Wyonna B
Bought by
Harris Tonya
Current Estimated Value
Home Financials for this Owner
Home Financials are based on the most recent Mortgage that was taken out on this home.
Original Mortgage
$7,500
Outstanding Balance
$2,454
Interest Rate
5.11%
Mortgage Type
New Conventional
Estimated Equity
$272,952
Purchase Details
Closed on
Mar 17, 2017
Sold by
Acosta Aissa Lynn
Bought by
Smith Wyonna B
Home Financials for this Owner
Home Financials are based on the most recent Mortgage that was taken out on this home.
Original Mortgage
$138,700
Interest Rate
4.15%
Mortgage Type
New Conventional
Purchase Details
Closed on
Apr 23, 2004
Sold by
Villas Of Pebble Creek Farm Sales
Bought by
Acosta Phyllis B
Home Financials for this Owner
Home Financials are based on the most recent Mortgage that was taken out on this home.
Original Mortgage
$143,900
Interest Rate
2.87%
Mortgage Type
New Conventional
Create a Home Valuation Report for This Property
The Home Valuation Report is an in-depth analysis detailing your home's value as well as a comparison with similar homes in the area
Home Values in the Area
Average Home Value in this Area
Purchase History
| Date | Buyer | Sale Price | Title Company |
|---|---|---|---|
| Harris Tonya | $272,000 | -- | |
| Harris Tonya | $272,000 | -- | |
| Smith Wyonna B | $146,000 | -- | |
| Smith Wyonna B | $146,000 | -- | |
| Acosta Phyllis B | $143,900 | -- | |
| Acosta Phyllis B | $143,900 | -- |
Source: Public Records
Mortgage History
| Date | Status | Borrower | Loan Amount |
|---|---|---|---|
| Open | Harris Tonya | $7,500 | |
| Open | Harris Tonya | $263,840 | |
| Previous Owner | Smith Wyonna B | $138,700 | |
| Previous Owner | Acosta Phyllis B | $143,900 |
Source: Public Records
Tax History Compared to Growth
Tax History
| Year | Tax Paid | Tax Assessment Tax Assessment Total Assessment is a certain percentage of the fair market value that is determined by local assessors to be the total taxable value of land and additions on the property. | Land | Improvement |
|---|---|---|---|---|
| 2025 | $4,315 | $113,080 | $20,000 | $93,080 |
| 2024 | $4,074 | $104,960 | $20,000 | $84,960 |
| 2023 | $4,074 | $102,560 | $15,400 | $87,160 |
| 2022 | $842 | $88,400 | $12,800 | $75,600 |
| 2021 | $835 | $68,120 | $10,400 | $57,720 |
| 2020 | $833 | $68,120 | $10,400 | $57,720 |
| 2019 | $777 | $64,120 | $10,400 | $53,720 |
| 2018 | $767 | $54,200 | $12,000 | $42,200 |
| 2016 | $1,718 | $46,040 | $8,000 | $38,040 |
| 2015 | $1,634 | $43,200 | $8,000 | $35,200 |
| 2014 | -- | $40,520 | $8,000 | $32,520 |
Source: Public Records
Map
Nearby Homes
- 314 Gable Brook Dr SW
- 2639 Cooper Brook Dr
- 2629 Cooper Brook Dr
- 2810 Cooper Brook Dr
- 2687 Pointcrest Way
- 2880 Cooper Brook Dr
- 181 Camry Ln
- 958 Bramble Way
- 3024 Gayle Manor Ln
- 706 Hawthorn Ln Unit 3
- 2984 Gayle Manor Ln
- 1028 Bramble Way
- 2880 Creekwood Dr
- 2797 Nathaniel Way
- 1205 Pebble Bend Dr
- 1135 Pebble Bend Dr
- 2979 Overwood Ln
- 2542 Haynes Meadow Ct
- 124 Camry Ln
- 126 Camry Ln
- 122 Camry Ln
- 128 Camry Ln
- 128 Camry Ln Unit 14
- 120 Camry Ln
- 120 Camry Ln Unit 120
- 130 Camry Ln
- 118 Camry Ln SW
- 125 Camry Ln
- 0 Camry Ln SW Unit 3107468
- 0 Camry Ln SW Unit 3182586
- 0 Camry Ln SW Unit 8832638
- 0 Camry Ln SW Unit 8851203
- 0 Camry Ln SW Unit 8467269
- 0 Camry Ln SW Unit 8416271
- 0 Camry Ln SW Unit 8354163
- 0 Camry Ln SW Unit 8326351
- 0 Camry Ln SW Unit 8315398
- 0 Camry Ln SW Unit 8041564