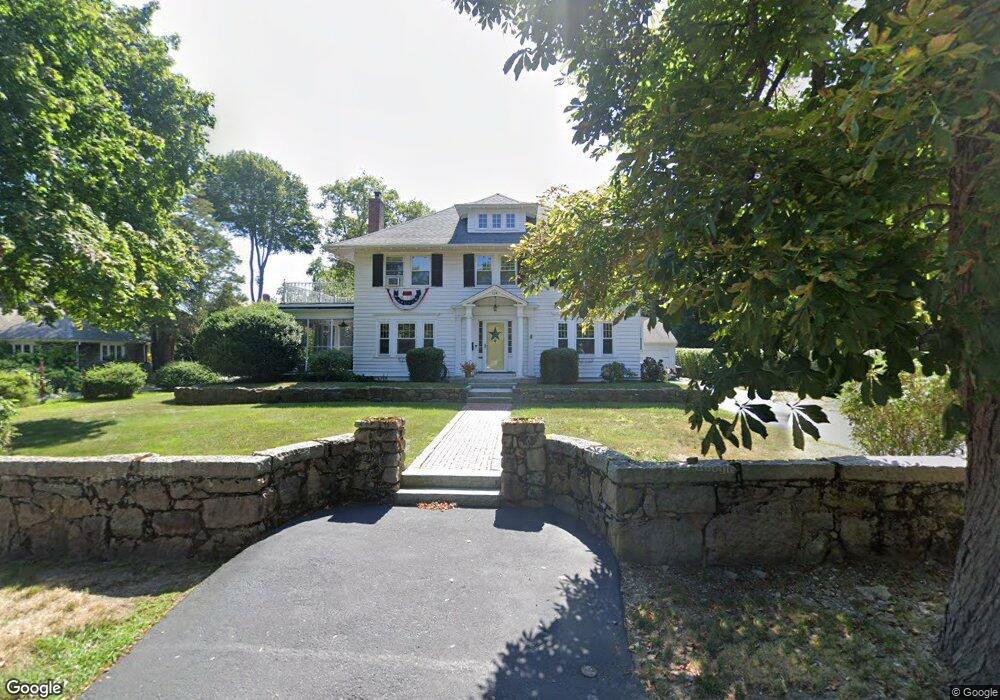
124 Cedar St Braintree, MA 02184
East Braintree NeighborhoodEstimated Value: $1,020,000 - $1,296,000
4
Beds
2
Baths
2,318
Sq Ft
$495/Sq Ft
Est. Value
About This Home
This home is located at 124 Cedar St, Braintree, MA 02184 and is currently estimated at $1,146,691, approximately $494 per square foot. 124 Cedar St is a home located in Norfolk County with nearby schools including Braintree High School, Meeting House Montessori School, and Step Ahead Kindergarten.
Ownership History
Date
Name
Owned For
Owner Type
Purchase Details
Closed on
Dec 16, 2005
Sold by
Johnson Francis D and Johnson Mary C
Bought by
Foley Jane C and Foley Joseph C
Current Estimated Value
Home Financials for this Owner
Home Financials are based on the most recent Mortgage that was taken out on this home.
Original Mortgage
$520,000
Outstanding Balance
$291,807
Interest Rate
6.34%
Mortgage Type
Purchase Money Mortgage
Estimated Equity
$854,884
Create a Home Valuation Report for This Property
The Home Valuation Report is an in-depth analysis detailing your home's value as well as a comparison with similar homes in the area
Home Values in the Area
Average Home Value in this Area
Purchase History
| Date | Buyer | Sale Price | Title Company |
|---|---|---|---|
| Foley Jane C | $650,000 | -- |
Source: Public Records
Mortgage History
| Date | Status | Borrower | Loan Amount |
|---|---|---|---|
| Open | Foley Jane C | $520,000 |
Source: Public Records
Tax History
| Year | Tax Paid | Tax Assessment Tax Assessment Total Assessment is a certain percentage of the fair market value that is determined by local assessors to be the total taxable value of land and additions on the property. | Land | Improvement |
|---|---|---|---|---|
| 2025 | $10,334 | $1,035,500 | $461,100 | $574,400 |
| 2024 | $9,109 | $960,900 | $411,700 | $549,200 |
| 2023 | $8,712 | $892,600 | $373,300 | $519,300 |
| 2022 | $8,445 | $848,700 | $329,400 | $519,300 |
| 2021 | $8,146 | $818,700 | $329,400 | $489,300 |
| 2020 | $7,683 | $779,200 | $289,900 | $489,300 |
| 2019 | $7,345 | $727,900 | $289,900 | $438,000 |
| 2018 | $7,204 | $683,500 | $263,500 | $420,000 |
| 2017 | $7,147 | $665,500 | $263,500 | $402,000 |
| 2016 | $6,756 | $615,300 | $237,200 | $378,100 |
| 2015 | $6,648 | $600,500 | $237,200 | $363,300 |
| 2014 | $6,087 | $533,000 | $196,500 | $336,500 |
Source: Public Records
Map
Nearby Homes
- 17 White Rd
- 30 Church St Unit 4
- 342 Elm St
- 9 Independence Ave Unit 307
- 192 Federal Ave Unit B
- 29 Joseph Rd
- 255 River St
- 177 Franklin St
- 347 Centre St
- 491 Washington St Unit 1
- 155 Kendrick Ave Unit 502
- 21 Totman St Unit 308
- 21 Totman St Unit 205
- 21 Totman St Unit 404
- 21 Totman St Unit 309
- 21 Totman St Unit 203
- 21 Totman St Unit PH-406
- 21 Totman St Unit 408
- 21 Totman St Unit 301
- 21 Totman St Unit PH-405
Your Personal Tour Guide
Ask me questions while you tour the home.