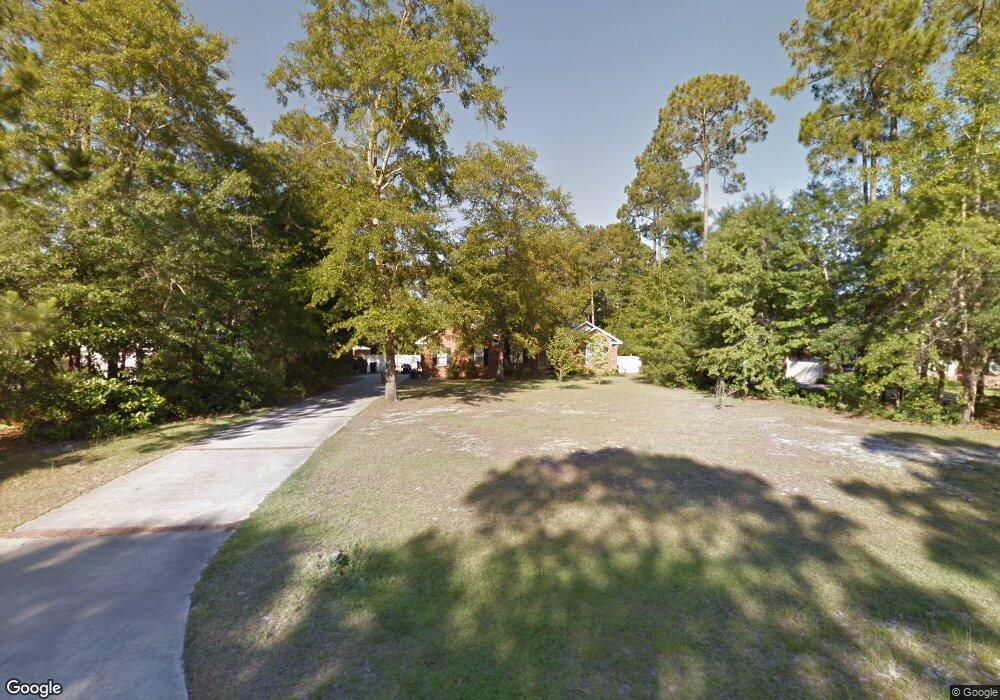
124 Crystal Dr Unit 10 Rincon, GA 31326
Estimated Value: $347,800 - $376,000
3
Beds
2
Baths
1,939
Sq Ft
$188/Sq Ft
Est. Value
About This Home
This home is located at 124 Crystal Dr Unit 10, Rincon, GA 31326 and is currently estimated at $364,950, approximately $188 per square foot. 124 Crystal Dr Unit 10 is a home located in Effingham County with nearby schools including South Effingham Elementary School, South Effingham Middle School, and South Effingham High School.
Ownership History
Date
Name
Owned For
Owner Type
Purchase Details
Closed on
Jul 29, 2015
Sold by
Kirkland Sonia Anderson
Bought by
Velazco Matthew and Velazco Angela F
Current Estimated Value
Home Financials for this Owner
Home Financials are based on the most recent Mortgage that was taken out on this home.
Original Mortgage
$204,000
Outstanding Balance
$159,568
Interest Rate
4.11%
Mortgage Type
VA
Estimated Equity
$205,382
Purchase Details
Closed on
Jul 21, 2015
Sold by
Anderson Franklin
Bought by
Kirkland Sonia Anderson
Home Financials for this Owner
Home Financials are based on the most recent Mortgage that was taken out on this home.
Original Mortgage
$204,000
Outstanding Balance
$159,568
Interest Rate
4.11%
Mortgage Type
VA
Estimated Equity
$205,382
Purchase Details
Closed on
Dec 21, 2006
Sold by
Wells Robert A
Bought by
Anderson Sonia and Anderson Franklin
Create a Home Valuation Report for This Property
The Home Valuation Report is an in-depth analysis detailing your home's value as well as a comparison with similar homes in the area
Home Values in the Area
Average Home Value in this Area
Purchase History
| Date | Buyer | Sale Price | Title Company |
|---|---|---|---|
| Velazco Matthew | $197,500 | -- | |
| Kirkland Sonia Anderson | -- | -- | |
| Anderson Sonia | $213,000 | -- |
Source: Public Records
Mortgage History
| Date | Status | Borrower | Loan Amount |
|---|---|---|---|
| Open | Velazco Matthew | $204,000 |
Source: Public Records
Tax History
| Year | Tax Paid | Tax Assessment Tax Assessment Total Assessment is a certain percentage of the fair market value that is determined by local assessors to be the total taxable value of land and additions on the property. | Land | Improvement |
|---|---|---|---|---|
| 2025 | $3,953 | $115,870 | $27,505 | $88,365 |
| 2024 | $3,953 | $124,292 | $22,800 | $101,492 |
| 2023 | $3,059 | $100,757 | $18,800 | $81,957 |
| 2022 | $3,237 | $100,757 | $18,800 | $81,957 |
| 2021 | $354 | $93,670 | $18,000 | $75,670 |
| 2020 | $320 | $85,487 | $16,800 | $68,687 |
| 2019 | $2,624 | $79,401 | $16,800 | $62,601 |
| 2018 | $2,520 | $74,760 | $16,800 | $57,960 |
| 2017 | $2,466 | $72,247 | $16,800 | $55,447 |
| 2016 | $2,404 | $73,812 | $16,800 | $57,012 |
| 2015 | -- | $64,934 | $12,000 | $52,934 |
| 2014 | -- | $64,934 | $12,000 | $52,934 |
| 2013 | -- | $62,934 | $10,000 | $52,934 |
Source: Public Records
Map
Nearby Homes
- 127 Crystal Dr
- 121 Crystal Dr
- 107 Charlton Rd
- 100 Usher Place
- 127 John Glenn Dr
- 5475 Mccall Rd
- 144 Lewis Dr
- 107 Melrose Place
- 105 Melrose Place
- 125 Westwood Dr
- 121 Westwood Dr
- 223 Melrose Place
- 204 Whitehall Ave
- 110 Katie Dr
- 100 Cypress Dr
- 5033 Mccall Rd
- 104 Frontage Rd
- 124 Oak St
- 0 Huger St Unit SA338762
- 144 Jennifer Cir
- 124 Crystal Dr
- 126 Crystal Dr
- 122 Crystal Dr
- 128 Crystal Dr
- 120 Crystal Dr
- 130 Crystal Dr
- 129 Crystal Dr
- 125 Crystal Dr
- 118 Crystal Dr
- 123 Crystal Dr
- 132 Crystal Dr
- 133 Crystal Dr
- 116 Crystal Dr
- 135 Crystal Dr
- 134 Crystal Dr
- 119 Crystal Dr
- 116 Stephens Dr
- 137 Crystal Dr
- 118 Stephens Dr
- 136 Crystal Dr
Your Personal Tour Guide
Ask me questions while you tour the home.