Estimated Value: $182,179 - $278,000
--
Bed
--
Bath
660
Sq Ft
$343/Sq Ft
Est. Value
About This Home
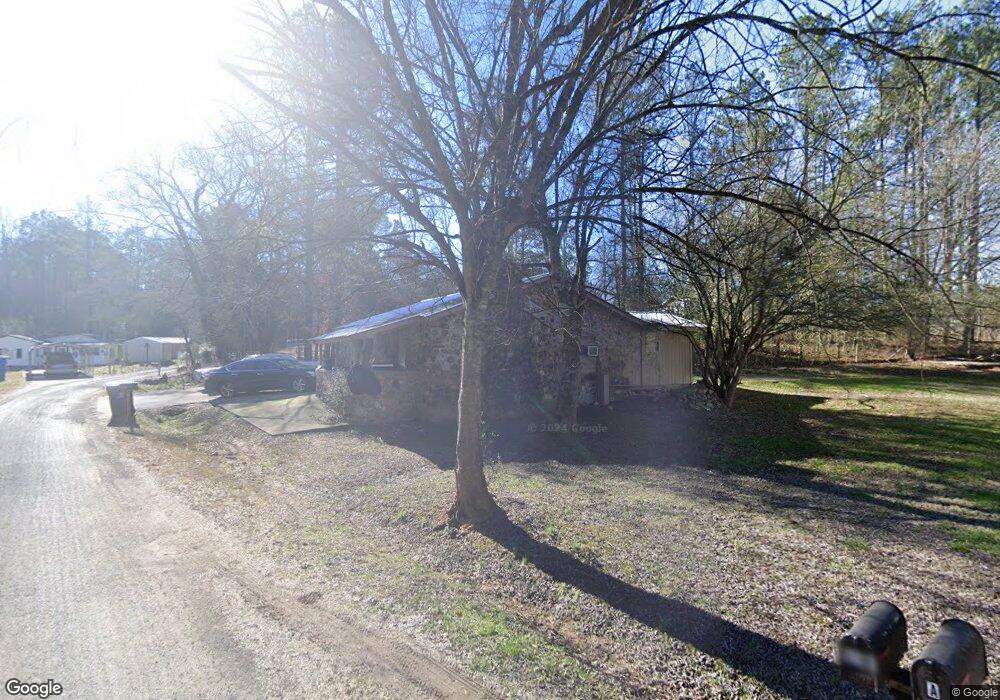
This home is located at 124 David Rd SE, Rome, GA 30161 and is currently estimated at $226,545, approximately $343 per square foot. 124 David Rd SE is a home located in Floyd County with nearby schools including Pepperell Middle School and Pepperell High School.
Ownership History
Date
Name
Owned For
Owner Type
Purchase Details
Closed on
Oct 17, 2019
Sold by
Lynch Debra Kay
Bought by
Lynch Calvin Brent and Lynch Debra Kay
Current Estimated Value
Purchase Details
Closed on
Sep 1, 2011
Sold by
Lynch Calvin Brent
Bought by
Lynch Debra Kay
Purchase Details
Closed on
Mar 10, 2003
Sold by
Thorpe Betty M and Johnson Ronnie E
Bought by
Lynch Calvin Brent
Purchase Details
Closed on
Feb 27, 2003
Bought by
P and R
Purchase Details
Closed on
Feb 20, 2003
Bought by
P and R
Purchase Details
Closed on
Aug 10, 2000
Sold by
Thorpe Betty M
Bought by
Thorpe Betty M and Johnson Ronnie E
Purchase Details
Closed on
Dec 30, 1999
Bought by
P and R
Purchase Details
Closed on
Nov 30, 1999
Sold by
Farmer James Larry
Bought by
Thorpe Betty M
Purchase Details
Closed on
Oct 24, 1995
Bought by
P and R
Purchase Details
Closed on
May 14, 1984
Sold by
Brooks Mildred
Bought by
Farmer James Larry
Purchase Details
Closed on
Aug 9, 1971
Sold by
Brooks J W
Bought by
Brooks Mildred
Purchase Details
Closed on
Jul 8, 1963
Bought by
Brooks J W
Create a Home Valuation Report for This Property
The Home Valuation Report is an in-depth analysis detailing your home's value as well as a comparison with similar homes in the area
Home Values in the Area
Average Home Value in this Area
Purchase History
| Date | Buyer | Sale Price | Title Company |
|---|---|---|---|
| Lynch Calvin Brent | -- | -- | |
| Lynch Debra Kay | -- | -- | |
| Lynch Calvin Brent | $46,200 | -- | |
| P | -- | -- | |
| P | $2,000 | -- | |
| Thorpe Betty M | -- | -- | |
| P | -- | -- | |
| Thorpe Betty M | $2,000 | -- | |
| P | -- | -- | |
| Farmer James Larry | $4,000 | -- | |
| Brooks Mildred | -- | -- | |
| Brooks J W | $100 | -- |
Source: Public Records
Tax History Compared to Growth
Tax History
| Year | Tax Paid | Tax Assessment Tax Assessment Total Assessment is a certain percentage of the fair market value that is determined by local assessors to be the total taxable value of land and additions on the property. | Land | Improvement |
|---|---|---|---|---|
| 2024 | $2,195 | $73,116 | $9,953 | $63,163 |
| 2023 | $2,092 | $70,745 | $9,048 | $61,697 |
| 2022 | $1,650 | $55,606 | $7,394 | $48,212 |
| 2021 | $1,495 | $49,523 | $6,742 | $42,781 |
| 2020 | $1,422 | $46,736 | $5,862 | $40,874 |
| 2019 | $1,345 | $44,780 | $5,862 | $38,918 |
| 2018 | $1,258 | $41,826 | $5,584 | $36,242 |
| 2017 | $1,216 | $40,346 | $5,170 | $35,176 |
| 2016 | $1,097 | $35,942 | $5,160 | $30,782 |
| 2015 | $1,072 | $35,942 | $5,160 | $30,782 |
| 2014 | $1,072 | $35,942 | $5,160 | $30,782 |
Source: Public Records
Map
Nearby Homes
- 1561 Pleasant Valley Rd SE
- 0 Powell Rd SE Unit 10606945
- 142 Ellis Rd SE
- 3810 Chulio Rd SE
- 375 Druid Rd SE
- 300 Ellis Rd SE
- 131 Hine Rd SE
- 0 Hillindale Dr SE Unit 10515824
- 0 Hillindale Dr SE Unit 7574083
- 344 Powell Rd SE
- 0 Lot #27 Hermitage Rd
- 1850 Pleasant Valley Rd SE
- 7 Shirley Ln SE
- 14 Jewell Dr SE
- 15 Jewell Dr SE Unit 3
- 0 Satcher Rd Unit 10626187
- 0 Satcher Rd Unit 7666911
- 0 Satcher Rd Unit 19425114
- 0 Satcher Rd Unit 4 19430080
- 0 Satcher Rd Unit 4 20170176
- 0 David Rd SE Unit 7113349
- 0 David Rd SE Unit 7027072
- 0 David Rd SE Unit 8005366
- 0 David Rd SE Unit 7635653
- 0 David Rd SE
- 106 David Rd SE
- 132 David Rd SE
- 80 David Rd SE
- 80 David Rd SE
- 80 David Rd SE
- 56 David Rd SE
- 12 David Rd SE
- 511 Nichols Rd SE
- 4 David Rd SE
- 411 Nichols Rd SE
- 411 Nichols Rd SE
- 449 Nichols Rd SE
- 516 Nichols Rd SE
- 424 Nichols Rd SE
- 400 Nichols Rd SE