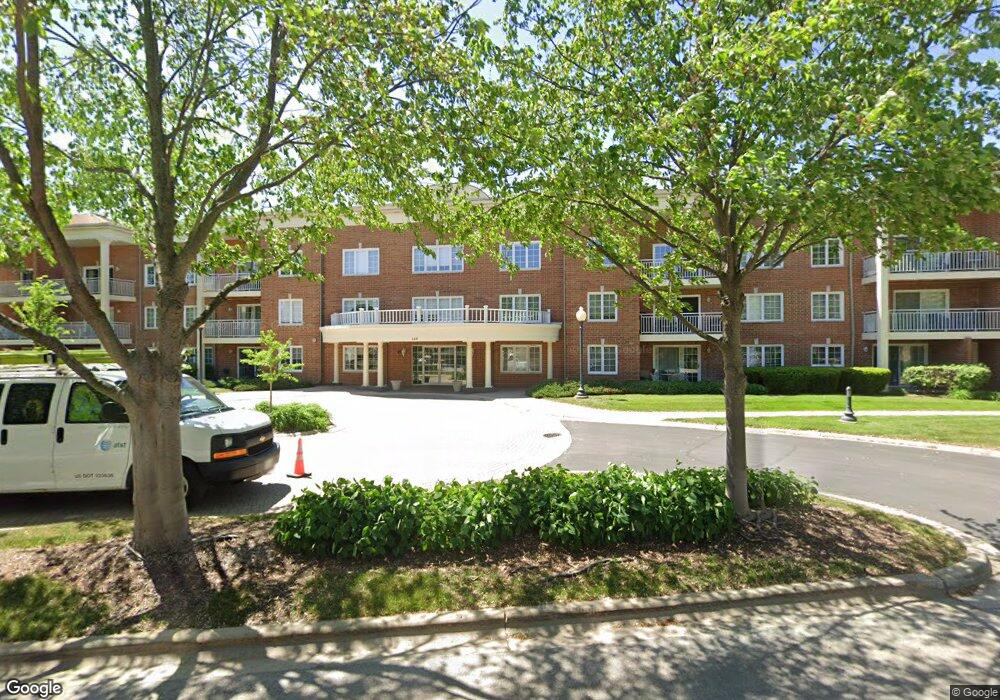
Bell Tower Place North 124 Day St Unit 204 Bloomingdale, IL 60108
Estimated Value: $251,000 - $310,583
2
Beds
2
Baths
1,379
Sq Ft
$207/Sq Ft
Est. Value
About This Home
This home is located at 124 Day St Unit 204, Bloomingdale, IL 60108 and is currently estimated at $285,146, approximately $206 per square foot. 124 Day St Unit 204 is a home located in DuPage County with nearby schools including Erickson Elementary School, Westfield Middle School, and Lake Park High School.
Ownership History
Date
Name
Owned For
Owner Type
Purchase Details
Closed on
Sep 17, 2024
Sold by
Mazurkiewicz Irene and Mazurkiewicz John
Bought by
Irene Mazurkiewicz Trust and Mazurkiewicz
Current Estimated Value
Purchase Details
Closed on
Jun 11, 2019
Sold by
Novak Kevin J
Bought by
Mazurkiewicz Irene and Mazurkiewicz John
Purchase Details
Closed on
Oct 6, 2000
Sold by
Barco Michael and Barco Vita
Bought by
Novak Mildred L and Mildred L Novak Living Trust
Purchase Details
Closed on
Apr 1, 1999
Sold by
Parkway Bank & Trust Company
Bought by
Novak Mildred L and Mildred L Novak Living Trust
Purchase Details
Closed on
Nov 23, 1998
Sold by
Parkway Bank & Trust Company
Bought by
Parkway Bank & Trust Company and Trust #11997
Home Financials for this Owner
Home Financials are based on the most recent Mortgage that was taken out on this home.
Original Mortgage
$240,000
Interest Rate
8.25%
Mortgage Type
Seller Take Back
Create a Home Valuation Report for This Property
The Home Valuation Report is an in-depth analysis detailing your home's value as well as a comparison with similar homes in the area
Home Values in the Area
Average Home Value in this Area
Purchase History
| Date | Buyer | Sale Price | Title Company |
|---|---|---|---|
| Irene Mazurkiewicz Trust | -- | None Listed On Document | |
| Mazurkiewicz Irene | $170,000 | Chicago Title | |
| Novak Mildred L | -- | Chicago Title Insurance Co | |
| Novak Mildred L | $161,000 | -- | |
| Parkway Bank & Trust Company | $291,000 | -- |
Source: Public Records
Mortgage History
| Date | Status | Borrower | Loan Amount |
|---|---|---|---|
| Previous Owner | Parkway Bank & Trust Company | $240,000 |
Source: Public Records
Tax History Compared to Growth
Tax History
| Year | Tax Paid | Tax Assessment Tax Assessment Total Assessment is a certain percentage of the fair market value that is determined by local assessors to be the total taxable value of land and additions on the property. | Land | Improvement |
|---|---|---|---|---|
| 2024 | $4,572 | $77,759 | $10,301 | $67,458 |
| 2023 | $4,145 | $71,110 | $9,420 | $61,690 |
| 2022 | $3,642 | $60,700 | $9,360 | $51,340 |
| 2021 | $3,472 | $57,670 | $8,890 | $48,780 |
| 2020 | $3,874 | $56,260 | $8,670 | $47,590 |
| 2019 | $4,121 | $59,060 | $8,330 | $50,730 |
| 2018 | $4,184 | $65,600 | $9,250 | $56,350 |
| 2017 | $3,913 | $60,800 | $8,570 | $52,230 |
| 2016 | $3,716 | $56,270 | $7,930 | $48,340 |
| 2015 | $3,610 | $52,510 | $7,400 | $45,110 |
| 2014 | $3,715 | $52,510 | $7,400 | $45,110 |
| 2013 | $3,695 | $54,300 | $7,650 | $46,650 |
Source: Public Records
About Bell Tower Place North
Map
Nearby Homes
- 119 W Lake St
- 166 W Lake St
- 148 Longridge Dr
- 178 W Lake St
- 177 Cardinal Dr
- 135 Fairlane Ct Unit B
- 134 Country Club Dr
- 244 Garden Way
- 123 W Confidential St
- 158 S Prairie Ave
- 253 Westminster Dr
- 6N375 Rosedale Ave
- 258 Thrasher St
- 286 Lorraine Cir
- 101 Donmor Dr
- 253 Sterling Ln
- 125 Lakeview Dr Unit 313
- 125 Lakeview Dr Unit 406
- 120 Lakeview Dr Unit 514
- 120 Lakeview Dr Unit 513
- 124 Day St Unit 101
- 124 Day St Unit 306
- 124 Day St Unit 208
- 124 Day St Unit 103
- 124 Day St Unit 203
- 124 Day St Unit 201
- 124 Day St Unit 309
- 124 Day St Unit 301
- 124 Day St Unit 104
- 124 Day St Unit 110
- 124 Day St Unit 105
- 124 Day St Unit 212
- 124 Day St Unit 111
- 124 Day St Unit 107
- 124 Day St Unit 304
- 124 Day St Unit 205
- 124 Day St Unit 109
- 124 Day St Unit 207
- 124 Day St Unit 311
- 124 Day St Unit 106