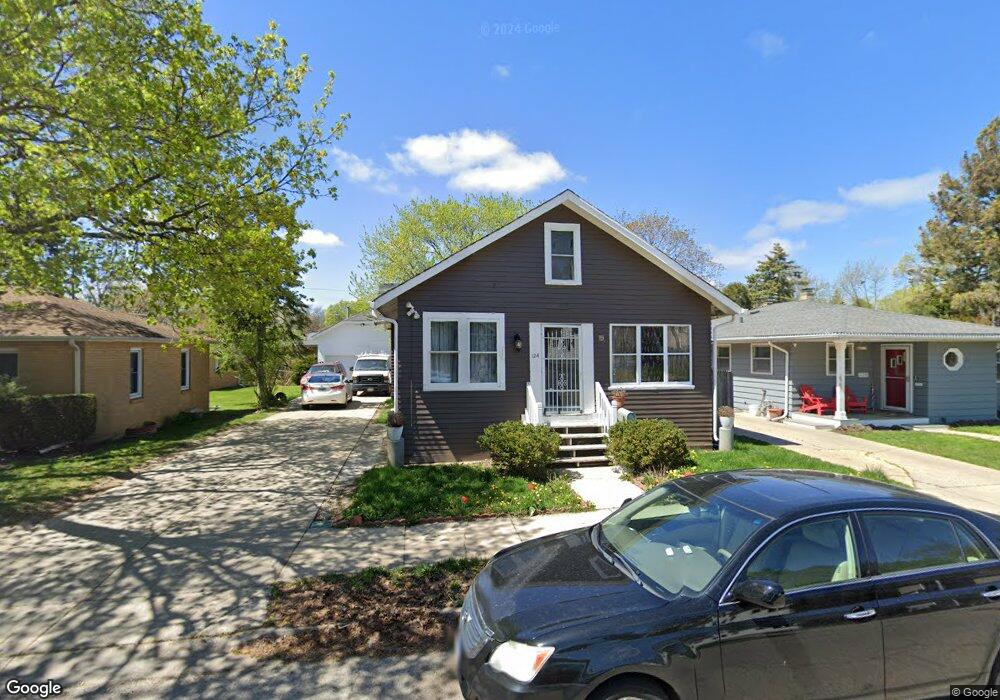
124 Dorchester Ct Waukegan, IL 60085
West Waukegan NeighborhoodEstimated Value: $210,000 - $234,000
2
Beds
1
Bath
1,046
Sq Ft
$211/Sq Ft
Est. Value
About This Home
This home is located at 124 Dorchester Ct, Waukegan, IL 60085 and is currently estimated at $220,574, approximately $210 per square foot. 124 Dorchester Ct is a home located in Lake County with nearby schools including Hyde Park Elementary School, Miguel Juarez Middle School, and Waukegan High School.
Ownership History
Date
Name
Owned For
Owner Type
Purchase Details
Closed on
Dec 12, 2022
Sold by
Sanchez Margarito and Sanchez Elizabeth Toledo
Bought by
Sanchez Elizabeth T
Current Estimated Value
Home Financials for this Owner
Home Financials are based on the most recent Mortgage that was taken out on this home.
Original Mortgage
$121,928
Outstanding Balance
$118,269
Interest Rate
6.95%
Mortgage Type
New Conventional
Estimated Equity
$102,305
Purchase Details
Closed on
Sep 14, 2005
Sold by
Garcia Jose and Garcia Blanca
Bought by
Sanchez Margarito and Barrios Lucio
Home Financials for this Owner
Home Financials are based on the most recent Mortgage that was taken out on this home.
Original Mortgage
$126,900
Interest Rate
5.87%
Mortgage Type
Purchase Money Mortgage
Purchase Details
Closed on
Nov 11, 2002
Sold by
Petersen Marilyn and Estate Of Alice T Wilder
Bought by
Garcia Jose
Home Financials for this Owner
Home Financials are based on the most recent Mortgage that was taken out on this home.
Original Mortgage
$105,346
Interest Rate
6.23%
Mortgage Type
FHA
Create a Home Valuation Report for This Property
The Home Valuation Report is an in-depth analysis detailing your home's value as well as a comparison with similar homes in the area
Home Values in the Area
Average Home Value in this Area
Purchase History
| Date | Buyer | Sale Price | Title Company |
|---|---|---|---|
| Sanchez Elizabeth T | $163,000 | Greater Illinois Title | |
| Sanchez Margarito | $135,000 | First American Title | |
| Garcia Jose | $107,000 | -- |
Source: Public Records
Mortgage History
| Date | Status | Borrower | Loan Amount |
|---|---|---|---|
| Open | Sanchez Elizabeth T | $121,928 | |
| Previous Owner | Sanchez Margarito | $126,900 | |
| Previous Owner | Garcia Jose | $105,346 |
Source: Public Records
Tax History Compared to Growth
Tax History
| Year | Tax Paid | Tax Assessment Tax Assessment Total Assessment is a certain percentage of the fair market value that is determined by local assessors to be the total taxable value of land and additions on the property. | Land | Improvement |
|---|---|---|---|---|
| 2024 | $3,425 | $49,509 | $8,230 | $41,279 |
| 2023 | $3,138 | $44,325 | $7,368 | $36,957 |
| 2022 | $3,138 | $38,094 | $6,717 | $31,377 |
| 2021 | $2,843 | $33,270 | $6,327 | $26,943 |
| 2020 | $2,833 | $30,995 | $5,894 | $25,101 |
| 2019 | $2,799 | $28,402 | $5,401 | $23,001 |
| 2018 | $2,243 | $23,732 | $6,372 | $17,360 |
| 2017 | $2,133 | $20,996 | $5,637 | $15,359 |
| 2016 | $1,892 | $18,244 | $4,898 | $13,346 |
| 2015 | $1,745 | $16,329 | $4,384 | $11,945 |
| 2014 | $2,318 | $19,237 | $5,010 | $14,227 |
| 2012 | $3,092 | $20,842 | $5,428 | $15,414 |
Source: Public Records
Map
Nearby Homes
- 132 Dorchester Ct
- 1416 Hamilton Ct
- 1521 Catalpa Ave
- 49 S Lewis Ave
- 23 N Jackson St
- 28 N Saint James St
- 2115 Lydia St
- 613 Washington St
- 304 Powell Ave
- 446 S Jackson St
- 610 Bluff St
- 557 W Water St
- 1213 Grand Ave
- 615 Tiffany Dr
- 511 Chestnut St
- 613 Clarke Ave
- 305 Besley Place
- 428 N Poplar St
- 0 Brookside Ave
- 215 S Park Ave