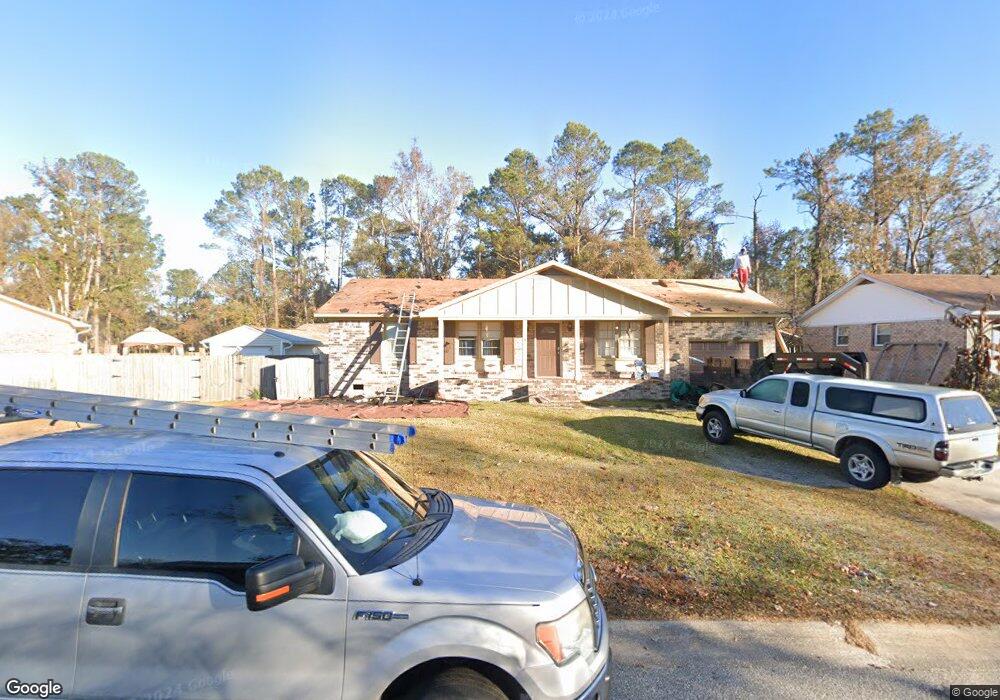
124 Drexel Rd Ladson, SC 29456
Estimated Value: $206,000 - $302,000
3
Beds
2
Baths
1,080
Sq Ft
$232/Sq Ft
Est. Value
About This Home
This home is located at 124 Drexel Rd, Ladson, SC 29456 and is currently estimated at $250,025, approximately $231 per square foot. 124 Drexel Rd is a home located in Berkeley County with nearby schools including College Park Elementary School, College Park Middle School, and Stratford High School.
Ownership History
Date
Name
Owned For
Owner Type
Purchase Details
Closed on
Mar 6, 2013
Sold by
Harkness Michael L and Harkness Michael Lee
Bought by
Nussman Stephen P and Nussman Maye O
Current Estimated Value
Home Financials for this Owner
Home Financials are based on the most recent Mortgage that was taken out on this home.
Original Mortgage
$52,000
Outstanding Balance
$36,745
Interest Rate
3.57%
Mortgage Type
Future Advance Clause Open End Mortgage
Estimated Equity
$213,280
Purchase Details
Closed on
Jan 10, 2006
Sold by
Gordon Benjamin S
Bought by
Harkness Michael Lee
Home Financials for this Owner
Home Financials are based on the most recent Mortgage that was taken out on this home.
Original Mortgage
$132,000
Interest Rate
6.18%
Mortgage Type
Future Advance Clause Open End Mortgage
Purchase Details
Closed on
Jul 27, 2000
Sold by
Durham Mickey D and Durham Emma B
Bought by
Gordon Benjamin S
Create a Home Valuation Report for This Property
The Home Valuation Report is an in-depth analysis detailing your home's value as well as a comparison with similar homes in the area
Home Values in the Area
Average Home Value in this Area
Purchase History
| Date | Buyer | Sale Price | Title Company |
|---|---|---|---|
| Nussman Stephen P | $65,000 | -- | |
| Harkness Michael Lee | $132,000 | None Available | |
| Gordon Benjamin S | $86,400 | -- |
Source: Public Records
Mortgage History
| Date | Status | Borrower | Loan Amount |
|---|---|---|---|
| Open | Nussman Stephen P | $52,000 | |
| Previous Owner | Harkness Michael Lee | $132,000 |
Source: Public Records
Tax History
| Year | Tax Paid | Tax Assessment Tax Assessment Total Assessment is a certain percentage of the fair market value that is determined by local assessors to be the total taxable value of land and additions on the property. | Land | Improvement |
|---|---|---|---|---|
| 2025 | $1,764 | $110,164 | $24,007 | $86,157 |
| 2024 | $1,729 | $6,609 | $1,440 | $5,169 |
| 2023 | $1,729 | $6,609 | $1,440 | $5,169 |
| 2022 | $1,667 | $5,748 | $857 | $4,891 |
| 2021 | $1,679 | $5,750 | $857 | $4,891 |
| 2020 | $1,686 | $5,748 | $857 | $4,891 |
| 2019 | $1,682 | $5,748 | $857 | $4,891 |
| 2018 | $1,566 | $4,998 | $1,200 | $3,798 |
| 2017 | $1,566 | $4,998 | $1,200 | $3,798 |
| 2016 | $1,580 | $5,000 | $1,200 | $3,800 |
| 2015 | $1,509 | $5,000 | $1,200 | $3,800 |
| 2014 | $1,415 | $5,000 | $1,200 | $3,800 |
| 2013 | -- | $5,000 | $1,200 | $3,800 |
Source: Public Records
Map
Nearby Homes
- 303 Houston Dr
- 3032 Adventure Way
- 104 Belmont Ct
- 3033 Adventure Way
- 1070 Briar Rose Ln
- 101 Ohio Way
- 3033 Kinswood Ln
- 2014 Hunters Bend Trail
- 418 Carolina Cir
- 246 Columbia Dr
- 1401 Dahoo Ln
- 2010 Cripplecreek Dr
- 418 Citadel St
- 205 Kentucky Dr
- 2003 Wishing Well Trail
- 4069 Exploration Rd
- 1204 N University Dr Unit A
- 1303 Discovery Dr
- 1349 Hermitage Ln
- 121 University Dr
Your Personal Tour Guide
Ask me questions while you tour the home.