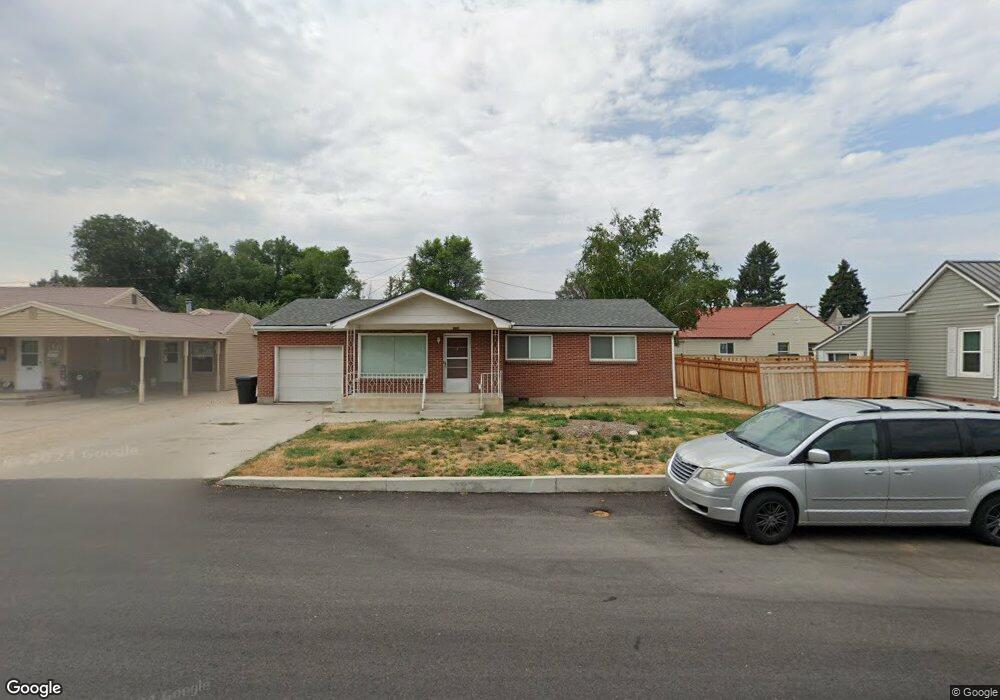
124 E 100 N Heber City, UT 84032
Estimated Value: $457,000
Studio
--
Bath
1,128
Sq Ft
$405/Sq Ft
Est. Value
About This Home
This home is located at 124 E 100 N, Heber City, UT 84032 and is currently priced at $457,000, approximately $405 per square foot. 124 E 100 N is a home located in Wasatch County with nearby schools including J.R. Smith Elementary School and Wasatch High School.
Ownership History
Date
Name
Owned For
Owner Type
Purchase Details
Closed on
Jul 16, 2021
Sold by
Revill John C and Revill Renita R
Bought by
Bishop Gerald and Bishop Geraldine
Current Estimated Value
Home Financials for this Owner
Home Financials are based on the most recent Mortgage that was taken out on this home.
Original Mortgage
$342,000
Outstanding Balance
$309,638
Interest Rate
2.9%
Mortgage Type
New Conventional
Purchase Details
Closed on
Jul 14, 2021
Sold by
Revill John C and Revill Renita R
Bought by
Bishop Gerald and Bishop Geraldine
Home Financials for this Owner
Home Financials are based on the most recent Mortgage that was taken out on this home.
Original Mortgage
$342,000
Outstanding Balance
$309,638
Interest Rate
2.9%
Mortgage Type
New Conventional
Purchase Details
Closed on
Jan 22, 2010
Sold by
Risner Reve F
Bought by
Risner Reve F and Revill John C
Home Financials for this Owner
Home Financials are based on the most recent Mortgage that was taken out on this home.
Original Mortgage
$124,500
Interest Rate
4.91%
Mortgage Type
New Conventional
Purchase Details
Closed on
Nov 2, 2006
Sold by
Risner Reve F
Bought by
Risner Reve F and The Risner Marital Trust
Purchase Details
Closed on
Aug 11, 2005
Sold by
Risner William S and Risner Reve F
Bought by
Burdette David L and Burdette Melanie
Create a Home Valuation Report for This Property
The Home Valuation Report is an in-depth analysis detailing your home's value as well as a comparison with similar homes in the area
Home Values in the Area
Average Home Value in this Area
Purchase History
| Date | Buyer | Sale Price | Title Company |
|---|---|---|---|
| Bishop Gerald | -- | First American Union Park | |
| Bishop Gerald | -- | First American Title | |
| Risner Reve F | -- | United Title Services | |
| Risner Reve F | -- | None Available | |
| Burdette David L | -- | Accommodation |
Source: Public Records
Mortgage History
| Date | Status | Borrower | Loan Amount |
|---|---|---|---|
| Open | Bishop Gerald | $342,000 | |
| Closed | Bishop Gerald | $342,000 | |
| Previous Owner | Risner Reve F | $124,500 |
Source: Public Records
Tax History
| Year | Tax Paid | Tax Assessment Tax Assessment Total Assessment is a certain percentage of the fair market value that is determined by local assessors to be the total taxable value of land and additions on the property. | Land | Improvement |
|---|---|---|---|---|
| 2025 | $4,446 | $477,200 | $240,000 | $237,200 |
| 2024 | $3,577 | $386,640 | $240,000 | $146,640 |
| 2023 | $3,577 | $341,576 | $125,000 | $216,576 |
| 2022 | $1,901 | $341,576 | $125,000 | $216,576 |
| 2021 | $2,412 | $344,268 | $114,000 | $230,268 |
| 2020 | $2,231 | $310,142 | $115,000 | $195,142 |
| 2019 | $1,943 | $156,828 | $0 | $0 |
| 2018 | $1,517 | $122,440 | $0 | $0 |
| 2017 | $1,348 | $108,160 | $0 | $0 |
| 2016 | $1,229 | $96,048 | $0 | $0 |
| 2015 | $999 | $81,846 | $0 | $0 |
| 2014 | $1,008 | $81,846 | $0 | $0 |
Source: Public Records
Map
Nearby Homes
Your Personal Tour Guide
Ask me questions while you tour the home.