Estimated Value: $158,000 - $318,000
3
Beds
1
Bath
2,286
Sq Ft
$97/Sq Ft
Est. Value
About This Home
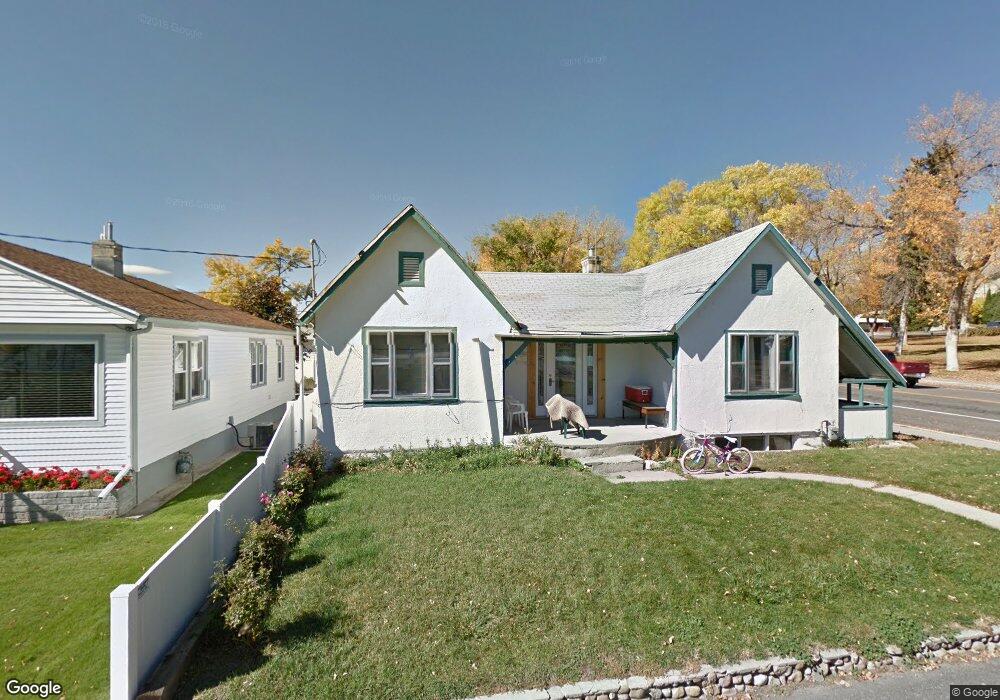
This home is located at 124 E 400 N, Price, UT 84501 and is currently estimated at $222,848, approximately $97 per square foot. 124 E 400 N is a home located in Carbon County with nearby schools including Castle Heights School, Mont Harmon Junior High School, and Carbon High School.
Ownership History
Date
Name
Owned For
Owner Type
Purchase Details
Closed on
Feb 2, 2015
Sold by
Rigby Steven W and Rigby Patrice A
Bought by
Rigby Steven W and Rigby Patrice A
Current Estimated Value
Purchase Details
Closed on
Dec 2, 2014
Sold by
Secretary Of Hud
Bought by
Rigby Steven W and Ribgy Patrice A
Purchase Details
Closed on
Apr 18, 2014
Sold by
Suntrust Mortgage Inc
Bought by
Secretary Of Hud
Purchase Details
Closed on
Apr 15, 2014
Sold by
Jones Josh N
Bought by
Suntrust Mortgage Inc
Purchase Details
Closed on
Nov 16, 2011
Sold by
Jack Josh N and Jones Kisty D
Bought by
Jones Josh N
Create a Home Valuation Report for This Property
The Home Valuation Report is an in-depth analysis detailing your home's value as well as a comparison with similar homes in the area
Home Values in the Area
Average Home Value in this Area
Purchase History
| Date | Buyer | Sale Price | Title Company |
|---|---|---|---|
| Rigby Steven W | -- | None Available | |
| Rigby Steven W | -- | Professional Title Services | |
| Secretary Of Hud | -- | Professional Title Services | |
| Suntrust Mortgage Inc | $80,633 | Professional Title Services | |
| Jones Josh N | -- | -- |
Source: Public Records
Tax History Compared to Growth
Tax History
| Year | Tax Paid | Tax Assessment Tax Assessment Total Assessment is a certain percentage of the fair market value that is determined by local assessors to be the total taxable value of land and additions on the property. | Land | Improvement |
|---|---|---|---|---|
| 2025 | $614 | $50,546 | $8,863 | $41,683 |
| 2024 | $908 | $75,615 | $9,900 | $65,715 |
| 2023 | $997 | $88,534 | $12,140 | $76,394 |
| 2022 | $1,036 | $82,502 | $10,094 | $72,409 |
| 2021 | $896 | $110,822 | $15,422 | $95,400 |
| 2020 | $881 | $54,684 | $0 | $0 |
| 2019 | $787 | $51,220 | $0 | $0 |
| 2018 | $743 | $49,345 | $0 | $0 |
| 2017 | $734 | $49,345 | $0 | $0 |
| 2016 | $662 | $49,345 | $0 | $0 |
| 2015 | $662 | $49,345 | $0 | $0 |
| 2014 | $658 | $49,345 | $0 | $0 |
| 2013 | $654 | $48,617 | $0 | $0 |
Source: Public Records
Map
Nearby Homes